Quantcast
Channel: Player Analytics - StatsBomb
Viewing all 25 articles
Browse latest View live

What Matters in Football? A Deeper Look at Chances Created

$
0
0
Luis_Suarez_fistpump

One of the goals of sport analytics is to convey rich information about a player or team in a single number or statistic. In football one of the main areas of interest is how much a player contributes to scoring goals, something which can be difficult to quantify given the rarity and stochastic nature of goals. I decided to look into developing a single statistic that can be used to compare relative contributions to chance or goal creation. Taking a cue from sabermetrics and baseball analytics, I’ve developed a series of comparative statistics for attacking contributions in soccer called “Chances Created”.

Baseball Model

One of the most influential statistics developed by Bill James, the father of sabermetrics, is called “Runs Created” (RC). RC was a response to baseball’s obsession with the RBI or run-batted-in which is very context and team specific often giving a skewed view of how much a player actually contributes to his team’s offence. RC in its most basic form looks at a players contribution by multiplying the player’s on-base-percentage by their total bases. The simplest test for RC was to see if a team’s RC total roughly added up to their total runs scored and the results were encouraging with a margin of error of approximately 5%.

Since the inception of RC there have been two major advancements. The first which was given the name “Runs Created Plus” (RC+) normalizes the average player’s value to 100, so a RC+ of 115 means that the player contributes 15% more runs than the average player. The second major change was weighting the statistic for several other quantifiable factors, hence “Weighted Runs Created Plus” (wRC+).

In developing a Chances Created statistic I took this approach so there are three separate statistics: Chances Created (CC), Chances Created Plus (CC+), and Weighted Chances Created Plus (wCC+). The goal of a statistic like this is the same as in baseball, find a metric that gives a better indication of a players contribution to the attack than just goals and assists which are clouded by lots of noise.

Chances Created

A chance in football corresponds to a shot, whether on target or not. There are two actions which directly create a chance, a shot and a pass that leads directly to a shot (a key pass). So at its core CC is just an accumulation of shots and key passes, but adjusted for playing time to shots and key passes per 90 minutes.

CC

The next step is to create a statistic that is normalized so that the average is 100. The problem with this is determining what the average player is in terms of chance creation. In baseball, every player has the same opportunity to bat whereas in soccer different players in different positions are expected to contribute different outputs offensively. So instead of normalizing for a non-existent, completely average player I divided players into four positions: goalkeeper, defender, midfielder and forward. Obviously there are a lot of debates about what these positions actually mean and there are players that play in different positions throughout the season. In order to keep as much objectivity as possible I’ve just used the players’ positions that they are assigned by the Premier League’s official fantasy league. Not a perfect solution, but as good a benchmark as I could think of.

In creating the average player I also think it is important to only include players who played a significant role in the season, not those who only play bit-part roles. Thus I’ve only included players who have played at least half of their teams games in the season (which in the Premier League is 19).

CCplus

Finally, I wanted to weight the chances created statistic to account for shot quality. We know that not all shots and not all chances are created equally, so the chances created statistic should also reflect the quality of these chances created. I decide to weight the statistic by assist rate and scoring rate which are essentially the percentage of key passes that lead to goals and the percentage of shots that lead to goals. Since I’m using an entire season’s worth of data the sample size is large enough that these percentages should align relatively closely with the percentages if I had used expected goals, or in other words the sample size should be large enough to drown out any significant noise that exists in the weights. For example if a player takes a lot of shots from poor positions their CC+ will be high, but their scoring rate will be low so their wCC+ will be lower accordingly.

SR    AR

wCCplus

Testing the Statistic

I think there are three key features that a statistic should have in order to be relevant and useful, it should have some explanatory capability, it should be repeatable and it should be simple to understand.

Explanatory: If the teams that have players with the highest CC, CC+ and wCC+ don’t create the highest number of goals then the statistic is useless since it is not connected to anything tangible that teams are trying to accomplish.

There are high r^2 values between the number of goals a team scores in a year and the average of their players’ CC+ and wCC+. The table below summarizes the r^2 values in the 2012-13 and 2013-14 Premier League seasons between the statistics and team goals scored. As the tables show wCC+ has more explanatory power than CC+ as we would expect.

r2 table

Interestingly if we look at defenders, midfielders and forwards on each team individually as well as the total average and run a regression on the total number of goals the team scored the individual position specific values are not statistically significant, so everything is captured by the total team average. In simpler terms, if a team’s forwards have a higher wCC+ than their midfielders it doesn’t mean they will score more goals, it is the team average of all positions that matter.

Repeatability: The statistic must have some predictive value. Therefore there must be some trend in the statistic from season to season so that a player’s CC, CC+ or wCC+ has some predictive power for their output in the following season.

Looking at the 2012-13 and 2013-14 Premier League season the r^2 value between wCC+ from one season to the next is 0.78. The scatter plot below shows the tight season to season trend in wCC+.

wCC+SeasonGraph

Simplicity: CC+ and wCC+ are designed to be as simple as possible in compare players. The benchmark of 100 for the average player at each position makes it instantly clear whether a player is above or below average in terms of offensive contribution. This is a statistic that is easy to read and even without the background on the methodology is easy to understand conceptually.

wCC+ Premier League Leaderboards

2012-13 Premier League Defenders

Defenders1213

2012-13 Premier League Midfielders

Midfielders1213

2012-13 Premier League Forwards

Forwards1213

2013-14 Premier League Defenders

Defenders1314

2013-14 Premier League Midfielders

Midfielders1314

2013-14 Premier League Forwards

Forwards1314

Some of the outliers like Kolarov and Schürrle come down to their classification as a defender and midfielder respectively when in reality they often play in more attacking positions. However, the lists in general seem to provide leaderboards that pass the “eye-test” when it comes to chance creation in the Premier League.

These leaderboards also demonstrate one of the limitations of the statistic. It can only really be used to compare players in the same position. As expected there is a much greater range for defenders than midfielders and forwards, because the denominator becomes steadily higher as we move further up the pitch. This also reflects common sense, there is a bigger range among defenders’ chance creation, who all have different roles in terms of attacking intent, than there is amongst those of forwards whose primary goal is to create chances. For example Kolarov doesn’t create more chances than Suarez despite having a higher wCC+, he just creates more relative to the average defender than Suarez does relative to the average forward.

That being said these leaderboards show how much better Luis Suarez has been than every other forward in the Premier League over the last two years. It is also nice to see this statistic reflect how vital Coutinho was to Liverpool’s 2013-14 season. The other stand out to me was Wayne Rooney’s consistency and impressive numbers over the past two years with wCC+ of 147 and 148. These production numbers fall in line with some of the other work on Statsbomb looking at Wayne Rooney’s career.

Overall I’m pretty pleased with the picture these wCC+ leaderboards give of chance creation over the last two seasons.

Next Steps

I’ve only used the data that I’ve complied to date which is 2012-13 and 2013-14 Premier League data. In order to really understand how widely applicable CC+ and wCC+ is we need to see how it works when applied to other leagues around the world.

The other area where changes could be made is in how the weights are applied. Assist rate and scoring rate are simplistic measures compared to potentially more indicative metrics like expected goals per key pass and expected goals per shot which would require a much richer data set. In the future these weights might give a statistic that better isolates an individual player’s contribution.

This is the first time I’ve ever tried something like this before so I’m open to critiques, suggestions and other tests people think would be applicable to further examine CC+ and wCC+.


More Discussion about Possession Adjusted Defensive Stats

$
0
0
Vidal_Tackle

This weekend, @7AMKickoff published a piece attacking the concept of adjusting defensive stats for possession. The piece was a bit dickish, but there were elements of it that deserve a reply, so I’ll do that today. For reference, here is my original look at possession adjusted defensive stats.

“I’ve done a fair number of regression analyses and I would probably never publish a .40 much less make some of the sweeping statements that Ted makes.” 

For starters, I think the piece reads as a fairly cautious look at new research, not something that makes sweeping statements, but I guess mileage may vary. To address the regression bit, obviously I’m fairly well versed in statistics myself, so why would I publish something with just a .4?

There are two primary reasons. The first deals with statistical relevance in complex systems and the second has to do with the relevance of base defensive stats themselves.

Let’s quickly deal with statistical relevance. While it’s generally true that you would prefer to explain everything with just one figure, in most real world examples that’s impossible. After I linked to the 7AM piece this weekend, a number of social scientists spoke up saying they would often be happy to explain .10 to .20 of variation, while .40 is actually fairly useful. There are certain metrics that can have up to .80 r-squared in explaining total goal difference (depending on what adjusted shots model you use), but explaining smaller pieces of the puzzle often gets hard, fast.

Football is an extremely complex game, and defense in particular is very a complex system with multiple potential fail points, covering defenders, presses, low blocks, etc.  (Unless of course, your manager is ‘Arry Redknapp, where your players just go fackin’ run about a bit.) When faced with complex systems, especially when just getting started, any additional relevant explanation is useful.

To put it another way, we know shots matter. How does one prevent shots? That’s a surprisingly tricky question to answer. Or at least it has been for me, and I’ve been frustrated about this for a while.

Now for the second point…

Did you know that by themselves, defensive stats like tackles and interceptions show zero correlation to anything useful? It’s true. They are just numbers on a page. They don’t correlate to shots against, goals against, goal difference, points, nada. This is despite them being an intrinsic part of the game, and the method by which most teams get the ball back.

But if you adjust for possession? Now you get the 40% explanation of variation. Going from absolutely no relevance to explaining 40% of important things seemed useful enough to write about. Keeping track of adjustments that have SOME explanatory power while continuing to search for better ones seems worthwhile.

That’s the phase that football analytics is in right now. It’s annoying to know that a lot of things you write about right now will be obsolete in a week, or a month, or in a year, but that’s part of the progression. If I talk about p-adjusted stuff now, maybe someone else will go down that line of research and create adjustments that account for 60 or 80% of the variation in shots conceded.

“Possession is a measure of offensive dominance.”

It’s really not, and I never suggested it was. For the most part, I ignore possession stats completely, as it seems like a relic of the tiki-taka Barcelona era and little more. It is, however, a useful measure for evaluating who had the ball more and made more passes, which in turn is tied to the opportunity to make defensive actions.

Break it out: The opportunity to make interceptions is tied to your opponent making passes. The opportunity to make tackles is directly tied to your opponent having possession of the ball.

This seems to be what 7AM disagrees with most, but to me it’s fairly clear. Just because every team doesn’t actually try to tackle or intercept the ball in all areas of the pitch doesn’t change the fact that these actions are tied together.

Is possession adjustment imperfect? Absolutely. I never suggested it to be otherwise. However, it lends statistical meaning to stats where none existed before. For me, that was enough to force me to change fairly significant amounts of existing code to include them when looking at player stats on the defensive side of the ball.

Is possession adjustment wrong (and um wrong)? That seems like a value judgment, so I guess it’s for you to decide.

I can tell you that p-adj stats are already on the fullback radars and will be used the other templates soon, so will be heavily incorporated in my work and the radar player charts I produce. What other people choose to do with them is out of my hands.

At the end of the day, I’m all for other people trying to adjust defensive stats to provide better explanations of metrics we care about. The only issue here is that they a) have to pass the theory barrier, and b) have to add statistical relevance. Do both and surpass what my initial attempt has done, and I’m sure the world will quickly adopt the new approach as more correct.

In the meantime, I’ll keep using imperfect stats as opposed to irrelevant ones.


EPL 2014-15 Season Preview – Everton

$
0
0
Rom Joins

 
What’s new?

At £4m, Muhamed Besic comes in as a low-budget, high-potential signing to ‘bolster’ midfield and defence. Flying wide-forward Gerard Deulofeu returns to Barcelona to be replaced by another loan – Chelsea’s Christian Atsu who played at Vitesse last year. Moves for last year’s loanees Gareth Barry and Romelu Lukaku have been made permanent. Everton has splurged about £30m (the majority of the budget) to keep hold of players already embedded in the side.


How did Everton line up last season?

The graphic below shows the main first XI and passing networks. The bigger the circle, the more touches the player had. The thicker the arrows, the more passes in that direction. For scale purposes, it’s all per 90 mins:


EvertonNode2014


It’s pretty clear how Barry became the hub of the side last season and why Martinez sought to make the move permanent. The player wasn’t short of offers it seems, which is presumably why Everton had to suck up a 3-year deal to secure the 33 year-old.

The build up is much shorter these days. Howard is as likely to distribute to the centre backs as he is to lump it. McCarthy is the continuity man, content to knock the ball sideways to Barry and Coleman who work the ball forward.

Also apparent is that the left hand side is still pretty huge. Where the left side is often intricate, the right hand side is more crash-bang-wallop with moves often ending at the feet of Barkley and Mirallas. Watching games last season you’d often see Lukaku’s frustration at these two (especially Barkley) failing to spot runs and going it alone. More on this later.


Will the line-up change with the new boys?

It’ll likely be as you were to begin with. But with League Cup games and Europa fixtures to negotiate in the early months both new boys will be featuring if fit. Martinez was very comfortable rotating players in and out last season. What with injuries, suspensions and loan restrictions none of the midfield or forwards were overworked minutes-wise. I can see the burden being shared around again.


People were worried that the defence wouldn’t hold under Martinez. How wrong were they?

Yep, only a goal a game conceded was in line with the previous few years. However, here at Statsbomb we’re dedicated (ching) to bringing you the underlying numbers that are more meaningful in the long term. The graphic below shows the the increase in total shots conceded and Expected Goals Against last season. This is almost always bad news:


DefensiveGraphic


Thanks to the work of Colin Trainor and Constantinos Chappas, we’re able to compare defensive actions visually. What we saw under Moyes was a super-concentrated effort to defend central ‘prime’ areas. Content with a draw or a 1-goal lead Everton would often shell defensively in order to see the game out. It was uncomfortable edge of the seat stuff.


DefensiveHeatmap


That hasn’t been the case under Martinez. There was a willingness to go toe to toe at the end of games last season using the likes of Mirallas, Barkley and Deulofeu to counter. It was a lot easier to watch. As we’ve seen , the underlying numbers suffered for this more open style. I’ve written previously about Tim Howard’s huge performance last season. Unfortunately for the Blues, history shows that such over-performance isn’t sustainable. Howard was undeniably good last season, but luck also played a huge factor. His save% from the prime Zone 1 area was 57%. League average is 44% – a keeper has more chance of callling heads or tails on a coin toss than saving a shot from here. Basically, the numbers suggest it’s far more likely that more of the same next season will result in nearer 50 goals conceded than 40. Unless the shot count goes down, expect Everton to get stung a little more often.


What about the attack?

Lukaku is a huge signing. The indications are that he’s on an upward slope. However, with Kone still yet to play a game since his knee injury in November, the only contingency at present is Steven Naismith. Naismith’s brain makes up for a lack of footballing aestheticism. His movement and finishing is good. I really like him, but he’s not up to being a starter for any length of time if Everton have serious pretensions of kicking on. That said, if I was in charge he’d be getting good minutes as a substitute on an almost weekly basis.

Everton’s other problem is what to do with Mirallas and Barkley. Both are super talented, but neither has the final output that marks them out as super special. A goal tally of 14 goals between them last season just doesn’t seem enough.

I read somewhere that at the press conference announcing Barkley’s new contract, the youngster stated he wanted to play more games in central midfield. Martinez apparently raised his eyes skyward. The kid might actually have a point. Here’s Barkley’s shot chart for last season. Yellow dots are goals, blue dots were saved, black dots were off target:


BarkleyShotChart


His shot on target rate was fairly abysmal. Too often for Barkley, shooting is a last resort when he’s off balance, out of ideas and the chance to play a team-mate in has gone. On top of this, he is still yet to record a Premier League assist. For someone in ‘the hole’, this simply isn’t good enough. The problem is that every now and then he goes and does something so ridiculously good (Swansea, Newcastle, Man City) that a lot gets forgiven and forgotten. Martinez needs to work out the pay-off between allowing time for potential to develop and pushing the team on results-wise.

The shooting story for Mirallas is a similar one. The Belgian blazes away with a scatter gun approach. Nominally stationed on the right, Kev’s best creative work is done out there. But being on that side creates problems with shooting angles for a right footed player:


MirallasShotChart


At Olympiakos he scored bags of goals while mostly stationed out left or through the middle. Everton still haven’t found Mirallas’ best fit. He’ll flit left or sometimes go through the middle to varying success.

I like the signing of Atsu. He profiles a lot like Deulofeu. He can beat players, and likes to take a shot but unlike the boy from Barcelona, he also has the ability to look up from his boots every now and again. Note the higher pass completion rate and key pass numbers:


DeuvAtsu


Conclusion?

Unless Everton stem the tide of shots then defence is going to get worse. Factor in the ageing of Jagielka and Distin who rely so much on mobility to do their thang, then look at the possible replacements. Alcaraz isn’t mobile, is the wrong side of 30 and is rarely fit. Stones, generally excellent on the ball doesn’t look like he can defend well enough yet at this level. Let’s cross our fingers and hope for a Coleman-style overnight transformation on that score.

Barry is 33. Is he going to be able to get around the pitch to the same effect?  Besic is beautiful on the ball and loves getting a challenge in but looking at him here, he’s suspect positionally. McCarthy has got a lot of defensive work on this season unless Gibson can get his arse off the treatment table for a spell.

Positively, I do expect the attack to pick up the defensive slack but that would rely heavily on Lukaku staying healthy. Getting Kone back ASAP would be a major bonus, especially if he can retain mobility following this his second major knee injury. Don’t rule out a move for a striker on deadline day, though.


Prediction?

5th-7th again. Probably 6th.


Scouting Report: Is Memphis Depay Another Andros Townsend?

$
0
0
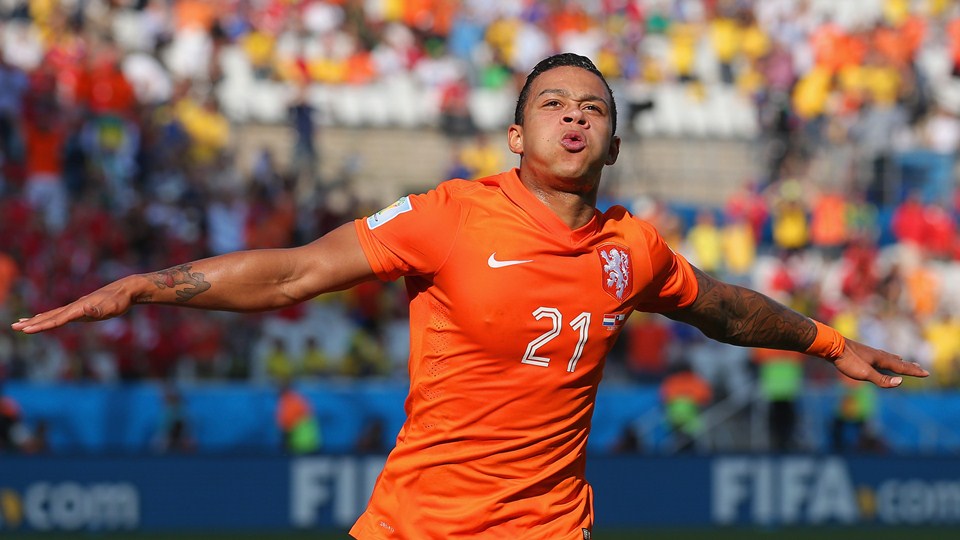
Memphis-Depay-of-the-Netherlands


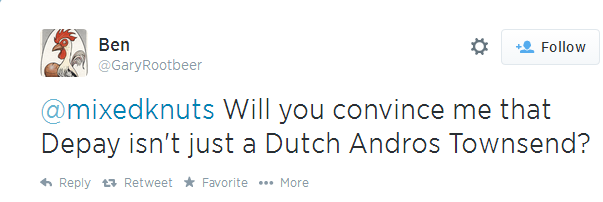
rootbeer4

An excellent question, and one that should concern clubs looking at spending between £15 to £20M on PSV’s left wide forward. Today I’ll tuck into both of their stats to find out.

First, Andros Townsend.


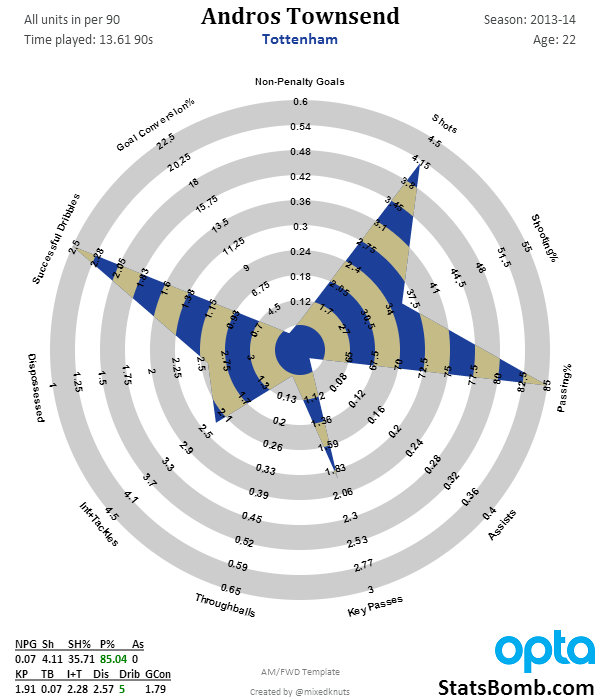
Andros_Townsend_2013-14

So much try, so little do. Elite dribbling and shot generation, good passing accuracy, plus decent key pass numbers. Useless when it comes to end product.

Now Memphis Depay, last season.

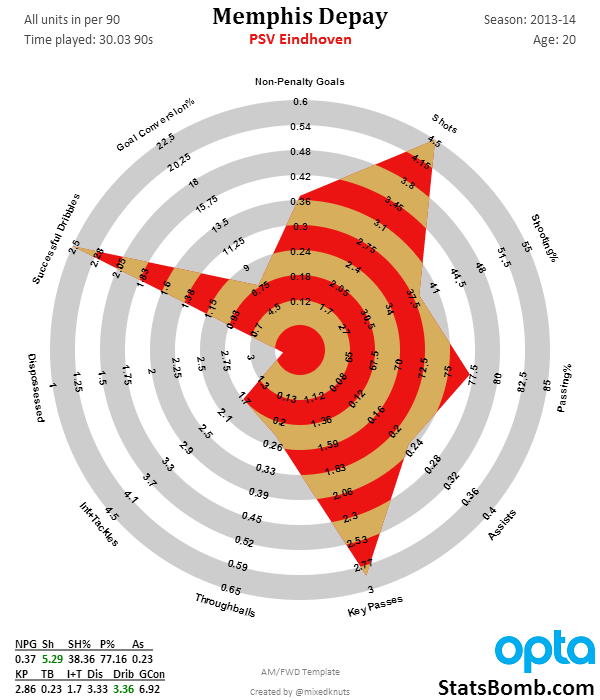
Memphis_Depay_2013-14


Huge key pass, shots, and dribbling numbers. For a wide forward, this is what is known as the trifecta. He also has good goalscoring and assist numbers, and his passing percentage is still good for a high-usage attacker.

Obviously it’s only two games, but if anything, Depay has stepped it up a notch this season. He’s currently averaging 6.68 shots, 2.57 key passes, 3 completed dribbles per90 and his scoring contribution (non-penalty goals + assists) is a stratospheric 2.06. He’ll cool off – 3 non-pen goals and an assist in 2 games is like surface-of-the-sun hot – but that type of start suggests improvement on last season where he was already good.

So where Townsend shows spikes in shooting and reasonable key pass output crossed with almost zero end product (goals and assists), Depay delivers. Last season, his scoring contribution was .6 goals and assists per 90, and he was 19 most of the season.  It should also be noted that PSV was really quite average last year.

If they played in the same league, or even in similar leagues (EPL is fairly similar to La Liga and Bundesliga, though in Bundes you need to lower everyone’s dribbling stats), then this would be easy. Since Eredivisie is a considerably weaker league than EPL, some of you will read this article, shrug, and go right back to what you thought before. That’s cool. I just want to note that while there have been plenty of notable busts from Eredivisie, there have also been plenty of players like Suarez, Strootman, Mertens, Eriksen, and recent Southampton addition Dusan Tadic that are super talented.

Let me explan a little more on why I think Depay is a rare talent.

How many guys last season across the five big Euro leagues and the Eredivisie created more chances per 90 minutes than Depay? (To cut down on small sample sizes, only players who played nine or more full 90s were considered.)

The answer: two.

Their names? Ronaldo and Messi.

Sure whatever… it’s one season.

Okay, expand the sample then. How many guys have created more chances per 90 in a single season over the last five years?

The answer: five.

Their names? Ronaldo (5 times), Messi (1), Suarez (1), Wesley Sneijder (1), and RVP (1).

Now granted, Depay had the lowest goalscoring and combined scoring rate of any of those players in his season and he played in a weaker league, but he did it at 19! All those other guys were in their mid-20s. Marco Reus in 13-14 was right behind Depay in chance creation numbers, and he did it at 24. Not all players age the same, but 19 is absurdly young to be putting up numbers like that in a real league. What if Depay keeps developing?  I’ve looked at quite a bit of data on young scorers and how they develop – I’d say it’s better than 50% odds that he will sell for £45M at some point later in his career. Can teams afford not to buy him now?

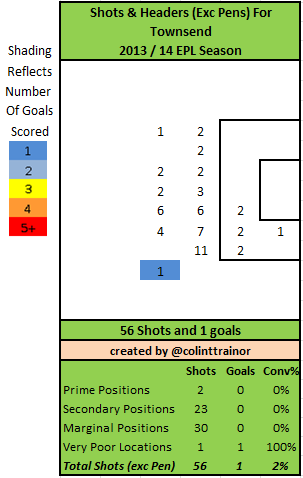
One common complaint you will hear is that Depay is wasteful with his shooting, and like Andros Townsend, he often shoots from poor locations. With some help from @colintrainor, we can examine that too.

Townsend


This is as bad as it gets. Seriously – how can a guy who is that good at dribbling be so bad at getting to good shooting locations? (The temptation to just graffiti “LOL” in the center of the entire box was overwhelming.)

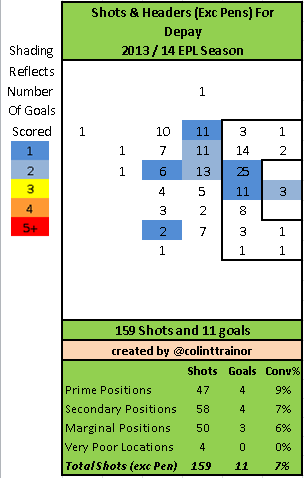
And here are Depay’s shots from last season.

Depay


159 shots, two-thirds from either prime or secondary positions. That’s not bad. Only a fractional amount from very poor positions is also positive. You would hope that with his great athleticism, he could push a little more forward in the coming years and get to 80% or so from prime or secondary, but this still isn’t that bad. Compare it to Townsend’s shot chart and it looks amazing.

Obviously it’s just my opinion, but Depay isn’t Andros Townsend. Depay is younger, has better underlying production, produces goals and assists. At just 20 years old, is one of the best young talents in Europe. (I had him ranked 2nd and Morata ranked 1st, mostly because Morata plays a slightly more valuable position.)

Andros Townsend? Still a question mark. As it is, he had a fluke goal and no assists in 13.6 90’s, which is abysmal. There’s talent there, but can it be harnessed? If you can move everything he does toward the goal by 6-7 yards, he’d be amazing – can that be coached? We’ll find out.

Which EPL teams could use Depay?
Which teams need elite left-sided attackers? Spurs for sure. Arsenal also need one, though they also need more depth and athleticism at DM to allow them to play a wider 4-3-3. Liverpool? Probably not, as they already bought Markovic and have Sterling and Coutinho who can both play there at a high level. Southampton certainly do, but at this point I am guessing he’s aiming higher than that. Everton could also use an upgrade out there, but after buying Lukaku this summer, we are out of their price range.

So with all of this in mind, and a rumored price tag between £15-20M, I only have one question left:

Why hasn’t Depay moved yet?

–@mixedknuts

What Is Wrong With Daniel Sturridge?

$
0
0
sturridge3

I buy the Times on occasion (not for political reasons, or an endorsement of Rupert Murdoch’s empire: I like some of the puzzles) and this Thursday there was an interesting small analysis piece on Daniel Sturridge written by Rory Smith.  What drew my attention was the general intention of the article to depict Sturridge as being “short of confidence”.  It went on to criticise Sturridge’s efforts against Blackburn citing amongst other things “poor choices”, being “unsure of his instincts” (?) and that his “energy [was] wayward and incoherent.”(??).   Nope, me neither.  He also “looked a shadow of the prolific goalscorer who terrorised defenses last season.”

Okay, maybe he didn’t have his best game?  What else?

“The less confidence Sturridge has, the more he seems to retreat into cockiness” and “[he] takes too many touches, slipping the ball under his feet, throwing dummies and feints, a desperate dance designed, perhaps [!], to convince him[self] of his own qualities.”

This latter section is a knowingly counter-intuitive argument and one which surely doesn’t hold firm.  Even without getting into the stats (we will) Sturridge has never seemed a man needing a shot of confidence to effect positive endeavour.

What does Daniel Sturridge do?

I’m pretty happy to declare that Daniel Sturridge is two things:

1. An elite level striker
2. Injury prone

The elite level striker angle is easy to prove: his entire career he’s consistently averaged four or five shots a game and mapping back even through his “kid learning the ropes” stages he averages over 0.6 goals per game.  He’s a pure striker, a darn good one and has always been so.  More fool Chelsea for selling him when they did.  But…

His injury record stinks.  He’s been involved in professional football since a young age and has participated in seven seasons. He was back-up or a rotational player in the early years but still, the guy is 25 years old and has never played more than 2/3 of a season.

2014-15

So, a familiar storyline of injury and absence and he reaches mid-April with only 750 league minutes to his name.  He “struggles to recapture top form” and has “only scored four goals since returning from several injuries.”

This seems like a fair argument if you blindly consider four to be a small number but if we pull up some shot and goal numbers, we can see that perceived problems may well be smaller than is being suggested:

sturridge2

I’ve highlighted two sections particularly to make the point. With data stretching over nearly 8000 minutes from 2009 to 2015 we have as near as we can get to career rates and despite it being a small sample in 2015 (he has only played 480 league minutes since returning from many months injured) we can also take a look at what he’s doing since coming back into the team.  I have also put in this season’s cumulative rate and his entire Liverpool career by way of contrast.

What can we see?

  • His career shot rate is 4.38, his Liverpool rate is similar and he’s recently above that level.
  • Whilst he is lacking in recent six yard box activity (“poaching”) his rate of penalty area shots to out of box shots has increased over time, and is currently high.
  • His on target rate is incredibly consistent across his whole career.
  • He has always and continues to takes all kinds of shot at similar rates (left foot, right, header).
  • His Key Pass rate is consistent throughout.
  • His Liverpool conversion rate is very high overall but has dropped back this season. Multiple studies have shown that conversion rates have poor levels of repeatability so change here cannot be solely attributed to anything apart from random variation.  He had been running extremely hot in this measure over the season and a half he’d been at Liverpool, much like Giroud, Costa or Kane are this season and a cooling off is not significant in itself.
  • His goal rate is a fraction beneath his career rate and 0.20 goals per 90 below his very high overall Liverpool rate.

Alright so; shots wise, he’s just dandy, goal-wise he’s a little off.  Well, again I can point to the small sample and suggest there is little cause for concern. Given the time he has been on the pitch, one or two more goals would have covered the conversion and goal per 90 deficits shown.  That’s it.  If you are to posit that Daniel Sturridge is out of form or “short of confidence” then effectively you are suggesting that he has reached this negative mindset via the method of missing one or two goal scoring chances.

And if I want to give Sturridge a break I really could.  I can identify three simple factors which could have impacted on his production in 2015:

1. He is playing in an unfamiliar formation (3-4-3), adaptation could take time.
2. He has just returned from a series of injuries and so may need time to gain full match sharpness.
3. He is no longer playing alongside one of the most devastating attacking players in the world, the dervish-like Luis Suarez.

Despite these factors, his personal contribution to Liverpool when in the team is solid in relation to his career and once more consistent.  I don’t see self-concern in Daniel Sturridge’s performances and I suspect that over time it will be seen that it was an extremely strange deduction to make.  The answer to the question posed in the title is simple: if fit, not a lot.


~~~~~~~~~~~~~~~~~~~~~~~~~~~~


Thanks for reading!


Find me on Twitter: @jair1970

Unluc-Kike? A Case Study On Middlesbrough’s Misfiring Forward

$
0
0
"Advanced stats Kike-ass"

With Middlesbrough cruelly confined to another year in the Championship, Patrick Bamford returning to parent club Chelsea and Jelle Vossen’s prospects of returning to the club after the summer shrouded in doubt (#KeepJelleVossen), the club’s forward line is looking a little light. In fact, this leaves Kike as the only established centre forward left in the squad. Having scored 10 league goals, there are question marks over his ability to lead the attack of a promotion-chasing side:

However, to what extent are these doubts legitimate? After all, Boro manager Aitor Karanka worked hard to persuade him to make the move from sunny Spain to perhaps-not-quite-as-sunny Teeside. Likewise his transfer fee, believed to be around 3 and a half million pounds, makes him a fairly heavy investment for a club like Middlesbrough.

Can he Kike it up a notch next year?

Can he Kike it up a notch next year?

The numbers

Well, I have good news along with some kinda-maybe-bad news. The good news is that Kike’s shot quantity numbers this season are awesome. Over the course of the season, Kike has been firing at a rate of 4.30 shots per 90 minutes played. For context, none of Ighalo, Deeney, Murphy or Rhodes shot above 3.64 per 90. Gestede, Nahki Wells and Brett Pitman came a little closer with 4.00, 3.99 and 3.93 shots per 90 respectively but still we can see that in terms of volume, Kike has had an excellent season.

Kike_2014-15_radar


However, as we can see on his radar, He is hampered by a low conversion rate despite getting roughly half his shots on target. That he is getting the shots on target suggests he is doing something right. In fact, conversion aside, he doesn’t compare too badly to Bamford.

“Bah, that volume doesn’t say much; those shots could be from anywhere. Darn evil number wizards…” I hear you say. Well, that’s true; unless you’re Charlie Adam, there generally isn’t much value in shooting from your own half, for instance. Kike’s conversion could be a product of poor shot selection. So, where has Kike been shooting from; can we separate the wheat from the chaff? Stealing Paul Riley’s terminology, Kike has taken just over 50% of his shots from the ‘wheat’ shooting zones of the centre of the box (where 9 of his goals have come from). The ‘chaff’ being wide areas in the box and outside the box that are generally associated with lower and more irregular conversion.

"Advanced stats Kike-ass"

“Advanced stats Kike-ass”

This is significantly less impressive than the shot volume posted earlier and is lower than all of the forwards listed above besides Nahki Wells. Given teammates Jelle Vossen and Player of the Year Bamford took 63% and 49% of their shots from wheat areas respectively (NB: Bamford’s figure includes games played on the wing which will be bringing the number down somewhat), it is possible that part of this is down to team effects.

So, great shot volume, but with numbers partially inflated by a higher proportion of poor-location shots than other top strikers (Caused by lack of pace? Or perhaps movement making space for others centrally?). Where does that leave us? Well, we can account somewhat for shot location with an expected goals (xG) metric. xG is a way of weighting shots based in their likelihood of resulting in a goal. Shots taken closer to the goal, for instance, are more likely to result in goals than those from range. My current model takes into account location, game-state and body part (headers are generally less likely to result in goals, for instance).

Using this, we can simulate Kike’s shots to estimate the likelihood of scoring a given number of goals under league average finishing.

Kike_xG_sim


Unluc-Kike?

The model suggests that a league-average finisher would score more than Kike’s haul of 10 more than 86% of the time given the same shots, with a most likely tally of 14. While it is difficult to draw too many conclusions based on just one season of data, xG over/under performance is generally not particularly repeatable. Pair this with the fact that he is getting his shots on target but not past the keeper suggests that we shouldn’t expect the current conversion rate to continue throughout 2015/16. In other words, though his finishing in 14/15 has been poor, it is unlikely to remain so bad next year; given similar shots, we would expect Kike’s goal total to improve.

(You’ll notice I have stayed away from the word ‘luck’, despite a desire to get mileage out of the pun. Luck is a pretty loaded word which can mean different things to different people and so I have tried to keep things in terms of repeatability)

Past performance

One last thing we can look at is Kike’s performance before Boro. (Unfortunately, I could only find goal numbers and not shots, so these numbers are lacking some context and perhaps ought to be taken with a pinch of salt).

The dashed line shows Kike's career average goals per 90. Also note that 08/09 and 11/12 seasons are particularly unreliable due to the low number of minutes played. Data from soccerway.com

The dashed line shows Kike’s career average goals per 90. Also note that 08/09 and 11/12 seasons are particularly unreliable due to the low number of minutes played. Data from soccerway.com

As we can see, Kike’s goals tallies have fluctuated over the years with solid 10/11 and 13/14 totals alongside disappointing 09/10 and 12/13 seasons (though the 12/13 season comes with the potential caveat of coming back from a season-long injury). His 14/15 scoring rate is not far below his career average and it’s quite possible he is a naturally low-scoring striker (the Championship’s Giroud, anyone?). In 15/16, I would like to see Kike shoot less from the wide zones in the box and focus on getting shots centrally (though we have not established a cause for the lower proportion of ‘wheat’ shots). However, given the shots numbers posted through the most recent campaign along with the fact that he ought to be fully settled in next season, I think Boro fans ought to have faith in Kike firing as Boro’s #9 in 2015/16.

———————————-

Find me on twitter here: @stats_snakeoil

Who Are The Most Promising Young Attackers In The Big European Leagues?

$
0
0
belotti

If I were to give you a list with these players names on it…

Felipe Anderson
Nabil Fekir
Raheem Sterling
Hakan Calhanoglu
Harry Kane
Paul Pogba
Romelu Lukaku
Paulo Dybala
Luciano Vietto

…then many of you would recognise it for what it is: established but young super talented players based in the top five European Leagues.  Run the numbers and these guys are the top guns.  One would imagine that many a boardroom has a list of paper with these names and others printed on it but transfers involving these players will not come easily.  Why so?  Well each of these players is either one of two things:

a) based already in the Premier League or
b) attached to a club qualified for next season’s Champions League.

These two factors imply further points:

a) they are already likely to be quite well paid and will be expensive
b) only a significant step up in club stature is likely to permit transfer.

By that regard, as we’ve already seen with the fees and wages theorised around any potential Sterling transfer, and provided that they maintain form going forward, these are players that will only interest the mega-rich clubs; nobody else can afford them.  We can see this already, as Dybala has recently agreed a £23m transfer to Juventus, Kane is thought to have rejected speculative interest from Manchester United and Pogba is high on Real Madrid and Manchester City’s wish list despite already playing for Juve.  Also Vietto seems set to join Atletico Madrid and with Memphis Depay already transfered the hipster choice for “transfer to watch” is Felipe Anderson. (A quick aside on Sterling: he’s the youngest player on the list yet played the most minutes.)

How have I actually derived these players though?  Well, it’s an inevitable trawl through the numbers, specifically, these players have all played a minimum of 1200 minutes in 2014-15 in one of the top five leagues, were 22 or younger on the 1st of January and i’ve fiddled with a measure that adjusts for a broad expectation of attacking contribution whilst eliminating freakishly high and likely unrepeatable rates.  This gives us players trusted to play and when playing, contributing.  Ted Knutson did something similar here on Statsbomb this time last year, but with wider scope and I suspect greater detail.  What i’m endeavouring to do is create a list of potential, some realised, others on the cusp.  We look for attackers because it’s easier and their contributions are far more measurable, indeed things like shots, goals assists and shot assists are measured and recorded.   Sam Gregory even devised a specific metric in a similar vein and later Colin Trainor took it that bit further.

But what of defenders? Well, solving defense is on the list of things to do, indeed it is on everybody’s list of things to do, so we’ll leave that for now.

“But you’ve just got a list of all the good players, what’s the point of that? It tells us nothing”

This is true. But also conversely it tells us everything: any estimation that generates the better players at the top is a positive.  Looking back at Ted’s work from last year and prior, he was identifying around a 70% hit rate for attacking talent.  What i’ve done is far more of an initial glance and i’m not claiming advanced modelling skills, but maybe we can generate a few names that are of interest.  And if your club should embark on a transfer bid for one of these names, wouldn’t it be cool to think that they had got smart, and were at least on some level using the numbers?  I think so.

So here we have, in no specific order three more names that might interest switched on teams, the conditions are sufficient minutes and young but not (yet) playing for an English or Champions League qualified team:


1. Andrea Belotti

belotti

In a marvellously neat finale to Palermo’s season, in the last moments of a game at Roma, Andrea Belotti stole in at the far post and studded the ball across the line to secure a 2-1 victory.  Despite only securing nine starts in 2014-15, he looks to have a future, given the sale of Dybala to Juventus.  Palermo spent most of the season playing a 3-5-1-1 with Vazquez behind Dybala, leaving Belotti little chance to secure meaningful game time but he scored four non-penalty goals (and two penalties), three of which secured 2-1 victories.

Somewhat of an outright striker, he contributed to a solid 4.3 shots per game, played over 1200 minutes and has represented Italy at multiple levels up to under-21s, in which he has a decent goal record.

Should Palermo entrust him with the starting striker’s role next year, he appears equipped to build on a promising first season in Serie A.


2. Diego Rolan

rolan

In his third season at Bordeaux, Rolan has broken though quite effectively, so much so that with Luis Suarez suspended for the Copa America, he has become Uruguay’s number 9.  Having only scored once in bits and bobs minutes in his first two seasons, 12 non-penalty goals have followed this year, most of which have come from a forward role, but he has also showed versatility and played in a variety of right sided positions.

He’s constructed 0.54 goals and assists per 90 minutes played from a 3.8 per 90 shot contribution, a decent ~30% of his teams shots. Bordeaux finished 6th in Ligue 1 this year, and with no European football forthcoming and just two years on his contract, it is quite possible that he will attract suitors.


3. Johannes Geis

geis

That a predominantly defensive midfielder should show up on this list is a testament to the qualities of Johannes Geis.  Two seasons of over four shots per game contribution for a 21 year old is highly impressive and that he has secured a starting spot and performed consistently in the middle of the pitch at such a young age is rare.

Like Belotti he is capped throughout his country’s youth system and has been strongly linked with a move away from Mainz with Dortmund suggested as a likely destination.

*Two other possible qualifiers that prospered for smaller clubs were Marcos Lopes (played at Lille, owned by Man City) and Fede Cartabia (Cordoba/Valencia).

So, each of these players performed at a promising level during 2014-15 and could well find the next rung of the ladder coming within reach very shortly.  And I think what i’ve represented here is that a starting point for potential attacking player analysis can be made using straightforward metrics revolving around shot creation.  None of this is a new procedure but it follows a similar line to some of the work we’ve seen before on this site and gives us a handful of names to watch out for in the future.

I would also hope that any club with a transfer budget to use this summer had performed, at an absolute bare minimum, similar fundamental analysis of the players within their range on the market.  My analysis was necessarily brief and top-level, I am merely highlighting, but there are many people in the analytics community that would be able to drill down far into the statistics and tailor their analysis for any requested nuance, and that can form part of the process towards recruitment, in hand with traditional techniques.

Pitfalls in transfers will never be eliminated, but the use of statistics and analytical techniques as an aid towards recruitment can certainly contribute towards a minimisation of error.


Thanks for reading


~~~~~~~~~~~~~~~~~~~~~~~


Follow me on Twitter here: @jair1970

Ten Intriguing Ligue 1 Attackers

$
0
0
Alexandre Lacazette


Last season, I did a piece on 10 intriguing Ligue 1 players and looking back on it nearly a year later, it’s kind of funny to see what’s happened since. Origi has for the most part reaffirmed my opinions on his caliber as a player (scoring goals in the league cup doesn’t count), Nabil Fekir and Jordan Amavi kept going and going and they both looked like legitimately great talents until they tore his acl’s while Jordan Ayew and Florian Thauvin are floundering away in the abyss known as the relegation race in the Premier League.

I wanted to keep this tradition going so I brought it over to StatsBomb for this season but this time, we’re only going to focus on attacking players. With the success that Ligue 1 players have garnered in the PL this season, it seems like a nice time to capitalize on that buzz by bringing to you some other players that have had interesting seasons so far. Some of these names you’ve heard about and know a bit, some you’ve heard their names only and probably a couple of them you’ve never heard of before. By the beginning of next season, don’t be surprised if a few of these players have been siphoned by a PL or other a continental side.

Alexandre Lacazette

This is probably the biggest name on the list, and his trajectory as a player has been fascinating. He’s gone from a “decent wing prospect” to “converted striker” to “Next best French Striker” to where we are now, which is “who the hell knows”. This dude scored 27 goals last season and visually, he looked every bit the part of the next great striker in European football.

However unravel the hoopla over his season and you notice some disturbing trends. For one, he converted on over 28% of his shots last year. That is a ridiculous conversion rate for anyone, even the likes of Lionel Messi and Cristiano Ronaldo. Eight of his goals were from penalties and his 19 non penalty goals far outpaced his expected goal output of 11.92. To illustrate this even further, here’s a graph showing the running totals for goals and xG output for Lacazette from the beginning of 2013-14 (when he started playing as a striker on a full time basis) to currently.

Lacazette xG

Strip out 14-15 and his goal scoring record is actually much more closely aligned with his expected goal output. I’m willing to entertain the idea that Lacazette is good enough in his finishing that he’ll have multiple years in his peak 24-30 years where he outpaces expected goals by 2-4 non penalty goals, but last year was a perfect example of so many volatile things working out. Alexandre Lacazette is a good striker who’s very athletically gifted and will probably command ~£20M on his next transfer (although a great argument could be had that Lyon missed the boat in not selling Lacazette in the summer where they possibly could’ve gotten £5-10M more for him than they will in the summer). His xG per 90 has hovered around ~0.4 since converting into a striker, which is an above average mark. Last season massively overhyped his actual talents, but he’s still a quality forward in the beginnings of his prime.

Michy Batshuayi

Pretty much everything I said about Michy from two months ago still stands. The guy has been dynamite this season and with the financial problems that Marseille have because of no Champions League football, there’s almost no chance in hell he stays past this season. Hell, he might leave in January if the right offer comes along. Spurs have been the most keen on signing him and if they get him, they’re getting potentially a top 10 striker in the world by the time he hits age 25. He is that good a prospect and if he ever learns to be a good playmaker, the world is his oyster.

Sofiane Boufal

In my season preview, I was really excited about Sofiane Boufal’s potential season. He was a bottle of lightning last season when Lille bought him in the January window and he was basically the only reason why you should go watch a Lille match (they’re not good). I even brought up the faint hopes that he could be the next Eden Hazard (the good Eden Hazard, not the imposter we’ve seen this season).

He’s taken much more of a leading role offensively in terms of touches, which is understandable considering the exodus of players Lille had in the summer. He’s been dispossessed much more this season compared to last season (4.2 vs. 2.7) and his added usage has been a microcosm into just how bad Lille are as a team. Boufal is actually producing better than he did last season, it’s just that no one has been able to convert the chances he’s created this season compared to last.

Season Key Passes per 90 Expected Assists p90 Assists P90 wCC+*
2014-15 2.5 0.294 0.531 121
2015-16 3.2 0.386 0.069 124

*Weighted Chance Creation plus is the soccer spinoff of weighted runs creation plus. It’s a decent snapshot into a player’s contribution to attack*

Boufal isn’t perfect and he can be selfish with the ball, but that’s probably attributed to trying to carry a quite frankly terrible supporting cast. He is a wonderful talent who’s underlying production has been steady for a decent sample size and with better teammates, he could be a player who routinely puts up 80-85 chances created and 8-10 assists per season.

Martin Braithwaite

I’ve had a fascination with Martin Braithwaite because his conversion rates have been constantly low despite a pretty decent shot profile, especially in his last two seasons. He hasn’t cracked a conversion rate higher than 11.3%  and in some ways he’s been the Anti Lacazette; a shot hungry forward who can’t convert on better quality chances. Braithwaite’s xG output of 11.2 this season actually outpaces Michy Batshuayi’s number  of 10.59 but he’s only scored six goals. If we do the same running total like the one for Lacazette, you can see the inverse of finishing ability.

Braithwaite xG

His low conversion rate is a symbol of Toulouse’s problems, with the club scoring 21 goals versus their xG output of 29.1. With the Ben Yedder situation hanging over the club, it’s very encouraging to see Braithwaite becoming a higher volume shooter while having a career high in shooting accuracy at 40.3% (not a great mark, but an improvement nonetheless).  If Braithwaite could ever get to the point where he improves as a shooter and becomes a passable finisher, he could be a great “buy low” type of striker for a midrange club in other leagues because he’s certainly athletic enough to hang in faster paced leagues.

Wahbi Khazri

A lot like Braithwaite, Khazri could be a very good value signing for a team needing a creative attacking player on the cheap. His xG+A per 90 mark this season is mirroring his G+A mark of 0.74, He’s just approaching his prime years and his wCC+ of 128.2 last season is at the very least some form of proof that this season is no fluke. With Bordeaux floundering in lower mid table this season and Khazri producing at borderline elite levels, his transfer fee could be even more cheaper than once thought. Khazri could be a great replacement for Leicester if they sell Mahrez and it would continue their succession of buying good players from Ligue 1/2 that no one have ever heard of.

Benjamin Moukandjo

Your annual “striker whose goal scoring tally is being inflated by penalties ” in Ligue 1 this season is Benjamin Moukandjo. His xG per 90 number of 0.297 is much closer to his NPG per 90 rate of 0.416 than his 0.653. Moukandjo has been decent this year and his goal scoring rate last year was okay as well but him being a top 3 goal scorers in France this season is way too flattering for the caliber of player he is.

Ryad Boudebouz/Casimir Ninga

It’s sad to see just how much Montpellier have fallen from their 2011-12 title winning team and this incarnation until mid October looked like legitimate relegation candidates. They were slow, ponderous and didn’t have any idea how to get past a set defense in the attacking third. The emergence of Boudebouz and Ninga has allowed Montpellier to be better equipped to create throughball opportunities and higher quality chances, highlighted by Montpellier scoring four goals on Lyon nearly a month ago.

Boudebouz’s form has been ridiculous. Dimitri Payet created the most chances in Ligue 1 last year with 131 and Boudebouz is on pace to end up with 126. It’s insane how much he’s risen from last season. I thought he was a good pickup for Montpellier because he somehow had a 1.6 key pass per 90 rate on a god forsaken terrible team in Bastia, but I sure as hell didn’t expect him to be challenging Payet’s mark from last season. There’ve been only four instances in the Opta era where a Ligue 1 player has created at least 100 chances or more. They are:

  • Nene in 2010-11 with 120
  • Mathieu Valbuena in 11-12 with 105 and 12-13 with 119
  • Dimitri Payet in 14-15 with 131

I’m skeptical he can keep this pace up, but if he does end up on that short list by seasons’ end, it’s going to be one of the sneaky great seasons Ligue 1 has ever seen from a player in the Opta era.

Ninga is the perfect striker for what Montpellier needed, which is a quick forward that will run behind the defense. Unlike Boudebouz who has a track record of being a decent creator, Ninga’s sample size is pretty damn small, his 4.22 xG output is less than his 6 non penalty goals scored and he’s currently got a 25% conversion so he could easily fall off. But even when he falls, just being an adequate striker would do Montpellier a world of good and help keep Boudebouz’s numbers at the pace it’s heading.

Abdel Barrada/Remy Cabella

Lets do a quick comparison between the two playmakers on Marseille.

Name Key Pass per 90 Assists per 90 wCC+
Abdel Barrada 3.5 0.478 127.7
Remy Cabella 1.9 0.143 71.4

So just by looking at the data between Barrada and Cabella, it looks like Barrada is a much bigger contributor to his teams’ offense and has been the better player so far this season. Yet, if we look at the minutes distribution, it hasn’t been reflected  in that way.

Name Minutes
Abdel Barrada 941
Remy Cabella 1299

Some of the minutes distribution has been because of injuries/deployment. Marseille have experimented with playing Barrada in a midfield three while deploying Cabella as a left winger but even then, Remy Cabella has played over 600 more minutes as a #10 over Abdel Barrada (886 vs 210) yet hasn’t come close to playing good football in his favorite position. Remy Cabella is a bigger name than Barrada, and as recently as May 2014, Cabella was an above average player for Montpellier. But he was terrible at Newcastle (mostly because of Pardew) and he’s been below average with Marseille. Him playing as much as he has is a detriment to Marseille and in some ways, it’s very similar to Marcelo Bielsa’s faith in Florian Thauvin last season before he eventually gave up on him.

I’m not totally certain what Barrada is as a player because he’s only played ~1200 league minutes in Ligue 1 over his career and his only other history was putting up unspectacular numbers at Getafe. So far to his credit, he’s been producing elite level playmaking numbers in his time with Marseille. Barrada isn’t Payet and doesn’t have his track record, but he’s certainly done a passable impression of 2014-15 Payet in the playing time he’s gotten and if Marseille have any dreams of finishing in a CL spot (they’re six points back of third), they need to hitch their wagon to Barrada as their #10 and start reigning in Cabella’s minutes.


Hatem Ben Arfa: Ligue 1’s Smoke and Mirrors show

$
0
0
ob_ab99e4_ben-arfa-realise-un-gros-debut-de-sais


His goals have been vine/gif worthy, he’s clawed his way back to the French National Team and he’s been part of a Nice squad that have scored the 2nd most goals in Ligue 1 this season. It’s been a renaissance for Hatem Ben Arfa, a player reborn after not playing in 2014-15 and before that languishing in the hellhole known as Newcastle. No one can argue that Ben Arfa hasn’t been exciting, and his dribbling exploits have embarrassed numerous players this season.

It’s just that all that excitement has been more or less a smoke and mirrors show. Ben Arfa at his high point in mid October was rocking a overall conversion rate of 30.4% and since then, it’s been a steady decline back into normalcy as he hasn’t scored in 707 minutes of play.

Ben Arfa 2

On the basis of this, some would expect that Ben Arfa should be able to bring himself back after hitting this rough patch in his season. I’m very skeptical of this for numerous reasons. The first being that a 14.3% conversion rate is still pretty high for the type of shooter that Ben Arfa is, a predominantly outside the box creator. His conversion rate inside the penalty area is still at a ridiculous 36.8% with the league average usually between 15-16%. And even the chances he’s creating inside the penalty area haven’t been of high quality. His running xG total has barely caught up with his goal total since his goal scoring binge finished two months ago.

Ben Arfa

You add all of these things together and the probable regression of his scoring rate inside the penalty area and a very logical conclusion can be made that Hatem Ben Arfa has benefitted from a huge amount of variance going his way this season.

Hatem Ben Arfa on the season has a wCC+ of 93.1, 6.9% lower than the average attacking player in Ligue 1 this season (wCC+ is obviously imperfect but it’s a decent snapshot into a players offensive value). Combine that with his xG per 90 being a paltry 0.21 and overall Ben Arfa’s offensive value has been rather pedestrian, but a ridiculous three week scoring streak has fooled everyone into believing Ben Arfa has been good this season. Perhaps an argument could be made that his dribbling this season and the proficiency of it has created more opportunities for Nice and traditional shot metrics can’t quantify that. Even if that’s true, Ben Arfa’s play has been way too inefficient for the amount of praise he’s garnered.

Ousmane Dembele: The Next French Phenomenon?

$
0
0
dem


As the Ligue 1 season winds down, storylines are starting to slowly dwindle down to a core trio: the race for the last Champions League spot is still as tight as when we last covered it (disclaimer: Finishing in the 3rd CL spot in Ligue 1 currently means you have to go through two playoff rounds to get to the group stage. No Ligue 1 team has made it past two rounds of CL qualifying since this started happening in 2013-14), PSG are staking their claim as possibly the greatest Ligue 1 squad ever, and Ligue 1’s poor showing in the Europa League has their coefficient dangerously teetering towards losing their 3rd CL spot.

Rennes are one of those teams that in theory have enough talent to finish in the top three. For a Ligue 1 side, they’re isn’t a shortage of attacking options. Paul-Georges Ntep hasn’t progressed quite as much as some had hoped for a variety of reasons but he’s only 23 and has high upside. The dream of Yoann Gourcuff recapturing what he once had at Bordeaux is dead but he’s still a decent player when healthy while Juan Quintero has put up decent creation numbers in only ~800 minutes this season. Despite the squad at hand, their attacking numbers range from mediocre to bad which could be a product of having substandard managing.

Perhaps the most shocking thing with Rennes this season is there’s a good argument to be had that none of those players I mentioned are Rennes’ best player. Ligue 1 is known for producing great talent through their academies and Ousmane Dembele could be the next one to add to that list. 1124 minutes is a small sample and it would be rash to make steadfast proclamations. Trying to project the ability of a player to blend into a different league is also tough to contextualize. Ligue 1 is notorious for being slower paced and though this season there have been numerous former Ligue 1 players who have transitioned well into the PL, you still can’t really know. For every Dimitri Payet, there’s a Florian Thauvin. For every Max Gradel, there’s a Remy Cabella.

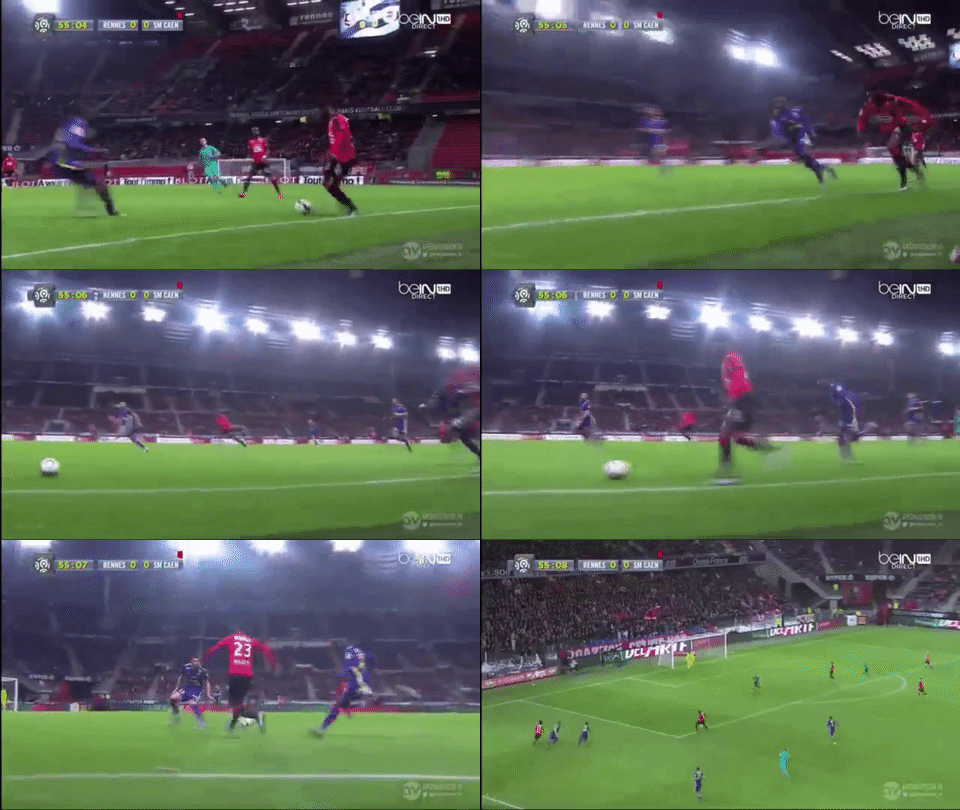
Having said all that, you can’t help but get excited at the potential Dembele’s got. I could only find 2-3 matches featuring Dembele that were of significant length so I can’t come up with a definitive scouting report on him but from what I’ve seen of him, he’s quite possibly the best dribbler in Ligue 1. There was this sequence versus Caen last week that would’ve been the goal of the season.

giphy (22)

I could name maybe four other players in France who could pull off that sequence of events. Dembele is averaging 5.5 completed dribbles per 90 this season. That’s not a misprint. It’s an absurd number that actually puts him ahead of everyone in Europe who’s played at least 1000 minutes this season. Higher than Neymar, Messi, Hazard, Lucas Moura. All the usual suspects you would assume to be #1 are behind Dembele.

giphy (23)

giphy (24)

At just 18 years old, he’s producing offense at a rate that’s quite rare. With at least 1000 league minutes played in an attacking position this season, there’s only two other players in the top five leagues under the age of 20 who have a shot contribution per 90 rate of at least four: Dele Alli and Timo Werner. That’s it, and you could even argue that what Dembele is doing is even more impressive because both Tottenham and Stuttgart are healthy shot generating teams while Rennes are almost the opposite.

If we look historically at U20 players in the top five leagues, the list is really short. Using the same criteria and extending it from 2009-15, I found 39 players that have contributed at least 4 shots per 90. Some of the results were really interesting.

Shot Contribution(using Opta data)

Look at that list and it’s got a good amount of star talent. Lukaku should morph into a top five striker in a couple of years. Sterling has probably plateaued since 2013-14 but he still has massive potential. Mario Gotze’s career has also stalled over the last two seasons but he was one of the highest rated young players when he was with Dortmund while Lamela and Carrasco are very solid wingers. There’s some duds in this list: Lucas Ocampos and Juan Iturbe look like potential lost causes, Oxlade-Chamberlain and Riviere are probably going to grade out as decent rotation players, novels could be written about Balotelli’s career and both Januzaj and Berahino have struggled for various reasons after bright debut seasons. Even then though, you look up and down this list and more players have turned out to be solid contributors than they have busts. And again, this kid won’t turn 19 until the middle of May and his production would rank right around the upper tier which is insane.

I wish I could take credit for the following comparison but I sadly can’t. I recorded a podcast with Julien Assuncao and he said that Ousmane Dembele was this season’s Clinton N’Jie; a fast paced winger who puts up promising offensive numbers in his first season in Ligue 1. I wrote about N’Jie last season and I was high on him even with his deficiencies and numbers being boosted by substitute effects because his pace and ability to get shots from good locations was really good. He obviously hasn’t had the same success for Tottenham so far because of injury but I still think he could be a quality LW/SS in the EPL.

The scary thing with Dembele is he’s nearly four years younger than N’Jie and having a season that’s pretty much on par but without the benefit of playing with the likes of Nabil Fekir and Alexandre Lacazette.

Player Shots per 90 xG per 90 wCC+ NPG per 90 KP per 90
Dembele 2.7 0.360 121.7 0.4 2.2
N’Jie 2.9 0.548 118.7 0.4 1.5

As always with a Ligue 1 player, the question will turn towards when will he move on for greener pastures. In theory, Dembele has some of the physical attributes to already make the jump to a higher quality league. He is the best dribbler in Ligue 1 and even with a jump in quality of opposition, he should still be able to get past defenders regularly. Despite being at times the focal point for Rennes, his dispossession numbers are actually quite respectable and i’d probably say that you could make a very convincing argument that he’s a more rounded player than N’Jie was when he left for Tottenham.

But just like N’Jie, I think it would be best if he stayed in Ligue 1 for another season or two. I’m the furthest thing from a qualified trainer, but it could be in his best interest to put on a little bit of strength to combat stronger defenders and the odd dirty challenge. Rennes are one of the few clubs in Ligue 1 with a little bit of money to play with and finishing 3rd in Ligue 1 would mean that the faint hopes of qualifying for the CL group stage would lead to Rennes upgrading the squad around him so he isn’t compelled to leave.

More than anything, he gets to be a main contributor on a decent team at a very young age which is something I highly doubt he’d get to experience if he went abroad. Say he followed his fellow compatriots and went to the PL, who in hell is prepared to have a 19 year old winger be a huge part of their side immediately while vying for Europe? Southampton is the only team I could somewhat see doing this just because they could be on the lookout for a Sadio Mane replacement and maybe their black box has Dembele as a transfer target.

1124 minutes does not make a career and being compared to a young Cristiano Ronaldo won’t help with calming down expectations for a teenager. In Dembele’s case though, it would be pretty surprising if he didn’t turn out to be a very good player. His production is right up there with most U20 players and he’s younger than anyone in that group. There isn’t much divergence between his statistical value and visually. Dele Alli is the only guy out there producing at a comparable clip to Dembele, and he’s doing it in a system that’s much more advantageous to racking up shot contribution numbers. Calling a player a phenomenon nine times out of ten is a fairly hyperbolic statement, but there’s the chance that Ousmane Dembele is the 1/10 scenario that actually lives up to the hype.

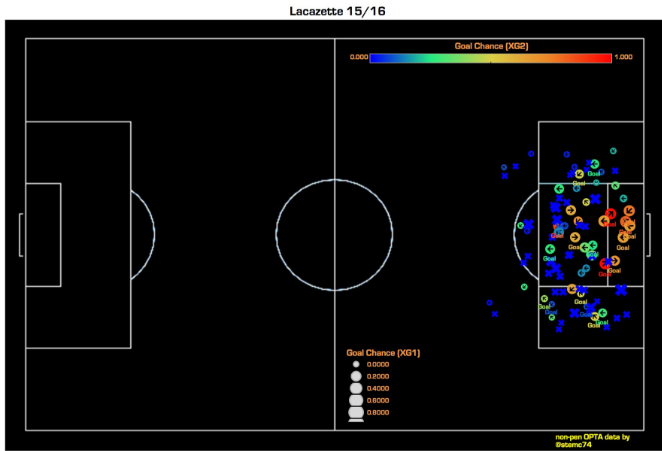
Design Diary – MK Shot Maps

$
0
0
Screen Shot 2014-11-13 at 23.13.32 copy

Note: All football data in this piece is from Opta and the visualizations were built using that information.

A long, long time ago – November 2014 to be precise – I was lamenting the state of public shot maps. The ones floating around at the time were okay, but they provided neither the clarity I was looking for, nor the scaling I wanted for use looking across periods of more than one game.  This isn’t to say the public ones are bad – more that I wanted to see if they could be done better.

My initial thoughts were that we might be able to do a Goldsberry style approach, adapted for football.

goldsberry_steph_curry

I explained this to my usual partner in crime, DOCTOR Marek Kwiatkowski (as he emphatically reminds me to call him). I have worked closely with Marek for years, and it’s safe to say he’s a bloody genius. The quality of my own work would be nowhere near as good as it is without his feedback. We’re like this…

muller_alonso

Anyway, he was intrigued by the idea and started programming. What follows is a design diary for how this idea developed from a frustration to something that was used constantly by the now defunct Football Analytics Team during my days at Smartodds (Brentford and FC Midtjylland).

Nov 10th, 2014

Hi Ted,

This is for Arsenal’s home performance last season vs Cardiff (two
late goals by Bendtner and Walcott).

arsenal_vs_cardiff
Legend:
circle=header, square=foot/other (triangle for own goals?)
Thick black outline=goal, medium black=on target, gray=rest
Colour=ExpG (the actual numbers are still wobbly, but it doesn’t
matter for the concept).

Some ideas:
* player numbers in the marker?
* half-sized marker for blocked shots?

Ted:
Things to consider:

Modified shapes for the following precursor events:

1) Throughball (Arrow?)
2) Successful Dribble (Triangle?)
3) Crosses (Chop 1/3 off whatever shape there is?)

Break colors into buckets for the following probabilities

1-.8: RED
.79-.7 – Red Orange
.69-.6 – Orange
.59-.5 – Orange Yellow
.49-.4 – Yellow
.39-.3 – Yellow Green
.29-.2 – Green
.19-.1 – Sequential Blues (from the PY spectrums you sent)
.09-.0 – Sequential Purples

As you said, there’s a lot going on in the lower ranges and it needs more attention. Adding 2 colors of sequential would see to meet that, but open to changes here.

Obviously with this I probably just broke the Green outline concept for goals. Shot on target a thin black outline is good.

I kind of think blocked shots should just show up as grey, as if they have been blotted out of existence because they don’t have a real expG value, but not 100%.

Long-term we can make these into an interactive app that has mouseover information for more detail.

Do you think adding player numbers inside the shapes will work or too much noise?

Marek:
Hey,

A few new versions.

Manual
gradient+manual

Goldsberry
gradient+goldsberry

Brewer
gradient+brewer

manual=me trying to follow email, goldsberry=colour-picked from him
directly, brewer=from colorbrewer2.org.
triangle up=from throughball, left/right=from cross, star=after dribble
dotted=header
grayed out=blocked

Outlines still to be worked out, unfortunately with the built-in
scatter function I don’t have enough control to do the black&white
one. I can look into writing a custom scatter later.

In general, I think we are at the limit of the info we want to pack
into these charts. I’m already not a fan of the dots/hatching, or even
the many marker shapes.

As to the colours, I think you were right to mention the ExpG
distribution itself. We should just partition it into ~10 classes of
equal size and colour code these with a nice sequential map. It is in
essence what Goldsberry is doing, I think. The downside is that the
class boundaries will be at awkward ExpG values, but at the end of the
day I’m not sure we care about that.

Ted:
Cool! Excellent effort. So much to process here, but that’s good. Now we can filter down what works and what doesn’t.

Of these I like Gradient + Manual best. Gradient + Brewer probably second, though it’s close.

I hate the dots – they just don’t work. 

Get rid of the directional cross arrows. It was a really good idea, but too information dense for the first pass.

Make headers circles (intuitive), regular shots hexes (or squares).

Stars and throughball triangles are pretty good, actually. 

Black and green outlines aren’t that bad.

Maybe have no outline at all on normal shots?

Obviously the legend will need to be crystal clear on meaning, but I think that will come quickly with usage as well.
Marek:

Little bit getting there, perhaps? I quite like this one.
test
The colormap (I know I’m anal about it) is the right half of ‘jet’
from http://matplotlib.org/examples/color/colormaps_reference.html. I
can now easily try any section of any colormap there if you want more
samples.

The goal outline works better with regular shapes to my eye (ie
triangle and star are a bit iffy), but it’s still easily the best I’ve
tried. Hexagon works better as default marker imo: the difference b/w
headers and shots doesn’t jump at you, but it’s clear enough to pick
it up immediately when you want to.

Ted:
This works. We’ll need to build a spiffy, detailed legend to explain it and then I’ll work on the poster display for the top section over the next few days for the info display there.

Poster_run1_Shot-Charts

At this point, Ted realizes he is WAY out of his depth trying to be helpful and this looks terrible. Therefore he asks actual professional designer and all around awesome dude @bootifulgame for feedback.

@bootifulgame sends back this, which makes Ted feel bad about how dumb he is, and about his life, and the fact that he’ll never be able to make truly pretty things.

Screen Shot 2014-11-13 at 23.13.32 copy

It just goes to show what you can do with an awesome professional designer involved and not just data dorks trying to solve problems. Alas, the final versions never quite looked as amazing as Ben’s.

These are some further test versions Marek did for single game plots.

spurs_double

hell

For individual player seasons, they looked like this:

Messi2012

cr7_alpha

Suarez2013


And for team seasons, they look like this:

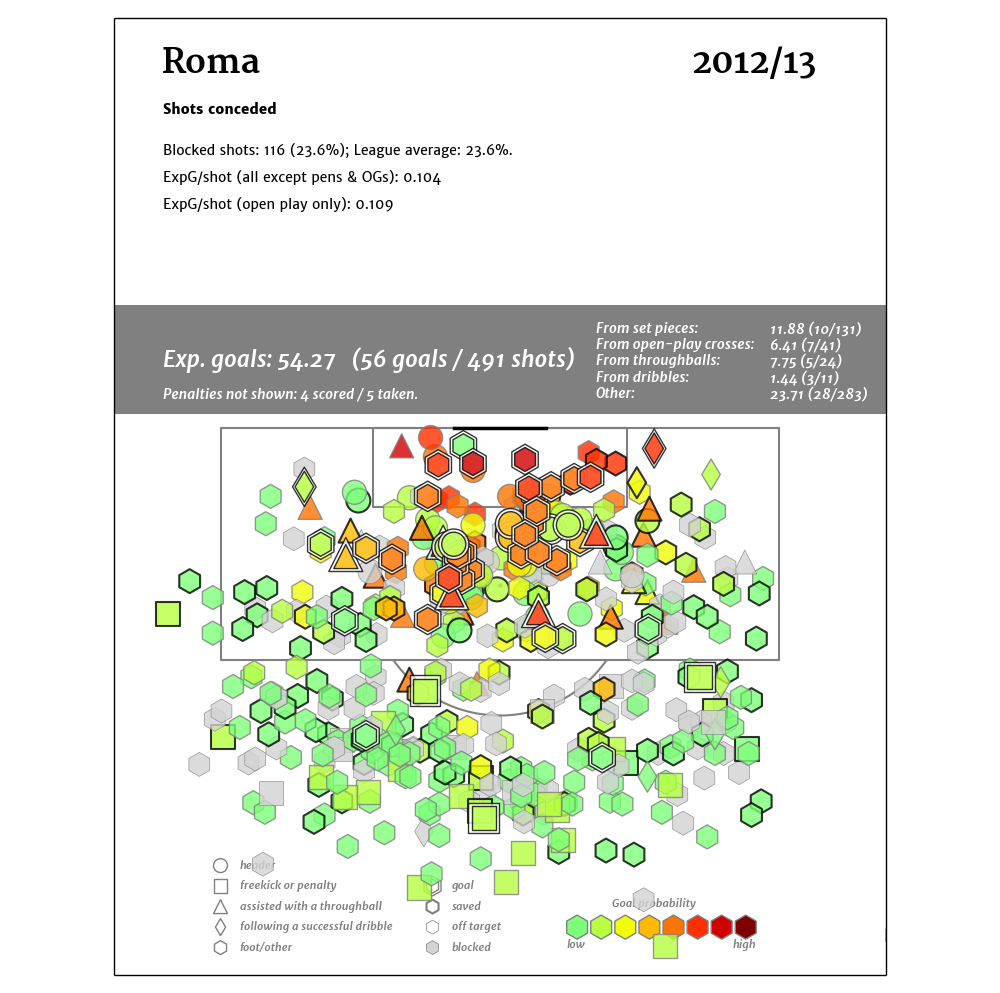
Roma_2012-13

Roma_2012-13_conc

What Changed?
There was some further tweaking to come.

  • Marek got rid of the Super Mario Brothers star for successful dribbles and moved to diamonds. The rest of the markers are fairly intuitive.
  • The lowest color on the plot was changed to .05 or lower probability.
  • There’s also plenty of other information that can be added in the legend, and you can make a million different data cuts for what you want to see. Open play is an obvious one here, but there are plenty of others.
  • They still get really busy for full-season maps for teams. Unfortunately there isn’t much you can do about that. We have a couple of different styles that were built later that try to suss out trends with less noise, but they also have issues.

Conclusion
So there you are, the MK (Marek Kwiatkowski) Shot Map variation and a detailed explanation of how they went from Marek fooling around on a problem to something attractive and useful. Combine them with expected goal race charts (originally seen in hockey, but something 11Tegen11 posts frequently on his Twitter account) and you end up with a fairly complete unit of game analysis, at least when it comes to shots.

Enjoy the Easter holidays,and maybe if I get some time next week, I’ll explain a bit more on how to use these charts to analyze team trends.

–TK

Opta-Logo-Final-Cyan


The Search For Confidence And The Hot Foot Theory

$
0
0
Football Soccer - Tottenham Hotspur v Crystal Palace - FA Cup Fifth Round - White Hart Lane - 21/2/16
Crystal Palace's Wayne Hennessey saves from Tottenham's Harry Kane
Action Images via Reuters / Andrew Couldridge
Livepic
EDITORIAL USE ONLY. No use with unauthorized audio, video, data, fixture lists, club/league logos or "live" services. Online in-match use limited to 45 images, no video emulation. No use in betting, games or single club/league/player publications.  Please contact your account representative for further details.

For an upcoming IntoPress piece on the ‘confidence’ trope in football, I decided to have a speculative foray into the numbers, drawing inspiration from the ever controversial ‘hot hand’ debate in basketball. That piece, one for a more general audience and with a wider discussion of the topic, will be available to read in a magazine edition released in May.

The polarized debate to which I wade into can be caricatured as something like this – in mainstream analysis, ‘confidence’ is often the explanation for what others may often call variance. If Harry Kane is on a poor run of goal-scoring form, missing a shot is a consequence of a lack of confidence, and vice versa. To the other camp, the one I confess to intuitively belonging in, this is largely unproven nonsense.

In the end, what I found wasn’t quite what I expected.

Method

The data used was event level data for the Premier League, La Liga, Bundesliga, Serie A, Eredivisie, Championship, and Ligue 1, as far back as the 2012/2013 season. I grouped the shots by player and season, before adding two extra rolling variables to each of them – ‘confidence5’ and ‘confidence10’, where:

ConfidenceX = Number of last X shots to have been a goal

This is by no means a perfect proxy for ‘confidence’ – it barely scrapes the surface of the linguistic connotations of the word, but it’s a starting point. It rolls between games, and so is slightly less vulnerable to score effects and game states, but not seasons. A shot taken by a player who had taken less than 5 or 10 shots in that season would get a Confidence5/10 score of ‘0’. I also randomly ordered the same set of shots and created the same variables in order to have a control group.

Aggregating by ‘confidence’ score and looking at average conversion rates, I was then able to test for any discernible linear relationship between the two. Applying Pearson’s Product-Moment Correlation and t-tests at a significance level of (< 0.05), ‘confidence5’ strongly correlated with conversion and in a statistically significant manner, while ‘confidence10’ correlated weakly but without significance.

Immediately sceptical of the ‘confidence5’ correlation, I ran the same calculations on the control group; at the rolling 5-shot level, it correlated fairly strongly, but without any statistical significance (p-value ~ 0.2). Nonetheless, I was concerned about sample size issues – in the whole dataset of shots, there were only 16 streaks of 5 goals from the 5 preceding shots, and some of these are the same player in quick succession: in two matches against Hertha Berlin and Werder Bremen last season, Bas Dost managed to take a shot having scored his last five 3 times.

In light of this, I filtered out any chances under 0.2 expected goals by my model and ran the same correlation tests – now, for a streak of 5, there were 150 examples (which still isn’t great). At the rolling 5 shot level, the correlation became even stronger and more significant (p-value ~ 0.02). With ‘confidence10’, the relationship was still not significant enough (p-value ~ 0.26) to reject the null hypothesis that it has no bearing on conversion. In terms of the possible effect being observed, this strengthens the possibility of a short-run ‘hot/cold feet’ phenomenon – if this was just picking up player quality, where players who score more will score more, it would probably be significant at the rolling 10-shot level too.

Applying the same filter and method to the control group, neither the 5 or 10 level was significantly correlated with conversion. As another check, I looked at the relationship between a shot in the sample’s xG and the average xG of the 5 shots before it – if this was high, any ‘hot feet’ effect could just be a proxy for the repeatability of chance quality at this micro level. As it turned out, they were correlated positively and significantly, but probably too weakly (correlation coefficient of ~ 0.014 by Pearson’s) for this to be the case.

Perhaps there really was an effect here.

Conf11


The relationship seems to apply to xG conversion too.

Conf13

Again, this isn’t the case for the control group.

Conf12

Going back down to the event level data with a logit regression for all chances over 0.2 xG, again the number of the last 5 chances scored was a significant factor in affecting the probability of one of these chances going in. Predicting the probability of success with this model based on ‘confidence5’ alone, I can then plot the relationship with 95% confidence intervals. The model has a McFadden pseudo-r2 of ~ 0.0022 (these tend to be “considerably lower” than OLS r2s in McFadden’s own words), and so is expectedly a small effect.
Conf9

Confidence Predicted Probability of Scoring
0 0. 3521575
1 0. 3745545
2 0. 3975019
3 0. 4209090
4 0. 4446772
5 0. 4687013

According to this, a chance (over 0.2 xG) preceded by 2 goals in the last 5 chances would have roughly a 4% higher chance of going in than one preceded by none. This is loosely equivalent to the difference between taking a shot from 15 metres out and 10 metres out, all else equal. If all 5 had been scored previously, it would predict roughly an 11% higher chance. I would be surprised if the effect was this large and this linear – as can be seen from the larger confidence intervals towards the higher confidence levels, uncertainty is an issue with the decreased sample size of larger streaks.

Conclusion

Although a small factor, one fairly tiny in terms of affecting the probability of scoring compared to, say, location, a ‘hot feet’ style effect may very well exist in the short run for non-terrible chances. The logical next step is to look at rolling expected goal over-performance as a predictor of shot success – I had a quick look at this and it got very complicated very quickly.


My methods are likely to be imperfect as a second year undergraduate, and like all endeavours in football stats, this is probably going to be complicated by systemic biases. As ever, I’m still sceptical, and so defer to the more capable and qualified to shoot this down. If you have any ideas about a way to improve the methodology or completely up-end it and test the theory in another way, I’m more than happy to talk about it: @BobbyGardiner.


Player Aging: Attacking Players

$
0
0
SterlingYaya

SterlingYaya

End of my Hiatus

First things first.  Although I never publicly announced it at the time, I’ve spent the last 12 months consulting for a Premier League football team.  My engagement ended at the end of the 2015/16 season and so now I’m able to pick up my virtual pen and begin writing again.  It’s been about 18 months since I’ve done this so please be gentle…


Player Aging

Player aging is a thing.  We know that people get physically stronger as they mature from a teenager into an adult and then some time later they begin to lose some of their physical edge.  That much is a fact, but what is open to some debate is when exactly those transitions happen, what is the extent of the improvement and subsequent decline and also whether players’ increasing tactical knowledge and “game sense” as they gain experience can help offset some of their loss in physical edge.

There have been other pieces written on player aging.  Simon Gleave did a presentation at one of the OptaPro forums on this topic, and he wrote this follow up piece.  Michael Caley has also written about this, as he has done with just about everything else to do with football analytics, but while most of the current writings tend to focus on the share of player minutes at each age I wanted to have a more detailed look at how some individual components of players’ performances are impacted as they age.


Data Rules and Explanations

As always, Opta is the source of the data that I’m using in this study and I’m looking at the Big 5 Leagues for the 6 seasons from 2010/11 to 2015/16.  I wanted to take a look at each position separately as the skills required for each position may be different.

I used the Opta starting formational information and included players who started the games, dividing them into the following positions:

  • Full Backs
  • Centre Backs
  • Midfielders (Central: defensive or attacking)
  • Wingers
  • Forwards

I undertook the analysis at a game by game level, so in the games where, for example, Christian Eriksen started centrally his numbers went into the Midfielder grouping, whereas when he played on the left side of midfield his numbers went into the Wingers grouping.  There may be an amount of arbitrary decision making around the position assigned to the players by Opta, but I think my method should ensure that players are broadly assigned to the correct positional grouping.

I then excluded any players that didn’t play at least 540 minutes in a given position and analysed the remaining players through the use of a few summary season metrics.  The hope is that we get an idea of how the individual components of a player’s game are impacted by their aging.

I grouped all players together who were younger than 20 (identified in the “Teen” group in the charts below) and at the other end of the scale I grouped all players that were older than 32 in the “Old” group.  At my stage in life, 32 actually seems quite young, but that’s probably a discussion for another day!

The player’s age for each season is taken as his age as at the 31st December in the season, and the individual metric value generated for each age group is the median value of its population. As there will likely be some variation across leagues I initially analysed each of the five leagues separately, but there was quite a bit of noise as some of the bins were too small so I decided to combine all the leagues to maximise my data size as I want to be able to identify the general trends.

In this first part of my look at Player Aging I will concentrate on the attacking positions, Wingers and Forwards.  Other positions should / may follow this article.

OK, so now on to the good stuff………


Wingers – Key Metrics

Let’s go straight in and look at the key attacking output of wingers; namely Open Play Shots, Open Play Key Passes (regardless of whether those KPs were converted or not) and Scoring Contribution.  Scoring Contribution is defined as Non-Penalty Goals and Assists, and as you are reading this on StatsBomb all three metrics are shown on a Per90 basis.

WingerOutput

The secondary axis (the one on the right side of the chart) is the axis for Scoring Contribution, whilst the main axis displays the Shot and Key Pass numbers.

Open Play Shots

The red line represents Open Play Shots per 90 minutes and there is a very tiny increase in this level until players reach the age of 26 (1.95 at 26yo vs 1.85 at 22yo).  After the age of 26 there is a very clear drop off in shot volume for wingers and by the time they reach 29 years old their shot volume has dropped to about 1.6.  There is then a small uptick at 30, but the pattern is clear; Shot volume for wingers reduces after they reach 26 years old.

Open Play Key Passes

Immediately we can see that for the blue line (Open Play Key Passes) the change in output for wingers as they age is not as severe as that observed in their change in shooting volumes.  There is a slight increase from teenage years until players reach the age of 23, and then it flattens until 28 when it begins it’s very slow decline.

One hypothesis for this almost (but not quite) horizontal line is that there are many different ways to play a Key Pass, for example, they can be created through a burst of speed or through the playing of a well-timed, accurate pass.  The former of these methods is more likely to happen with younger players, whereas the latter may be suited to a more experienced player and so we don’t really see age having much of an impact on how creative wingers are.

Scoring Contribution

The green line, which represents Scoring Contribution, is the absolute key one in terms of final output for attacking players as it represents how many Non-Penalty goals they either score or directly assist.  The pattern here for wingers is very clear as it steadily increases from their teenage years until they reach 26, at which point it begins its steady decline.

In absolute terms, the median Scoring Contribution value for 21 year old wingers is 0.29 Per90, and this increases to 0.34 by the time they reach 26 years old, and then decreases to 0.28 by the time they reach 30.  Those differences may sound small, but over a 38 game season the difference in the output between one 26 year old and one 30 year old winger comes to almost 2.30 goals.


Forwards – Key Metrics

We’ll now run the same analysis for Forwards as we did for Wingers.

ForwardsOutput

It’s probably no great surprise to see that the lines on the Forwards key output charts following similar patterns as those seen in the Wingers’ chart.  Shot volume increases until it peaks at 27 while Key Pass volume broadly remains fairly flat throughout the career of a forward.

In terms of the composite metric, the green Scoring Contribution one, there is an anomaly with 32 years and older forwards performing very well (notably in Italy). I assume there will be a large element of survivor bias in this number as any 32 year old (or older) that is playing is more likely be doing so because they are performing whereas the same probably can’t be said for the average 30 year old forward.  However, leaving this wrinkle aside we can see a general increase in Scoring Contribution for forwards until they reach 28 years of age, at which point their numbers can expect to decline.

The extent of the decrease in Scoring Contribution between a 28 year old forward and a 24 or a 30 year old forward is similar to what we seen when looking at wingers.  The median 28 year old clocks up 0.43 Scoring Contribution Per90, compared to 0.37 for both a 24 year old and a 30 year old.  This lack of a peak age forward leading the line for a team again equates to an expected shortfall of 2.30 goals over a full season.


Wingers – Other Metrics

Apart from the key output metrics I wanted to look at how a few other metrics reacted, across the population as a whole, depending on the age of the winger.

WingerOthers

Dribbling

Two of the metrics on the above chart relate to dribbling.  The yellow line is the traditional Successful Dribbles stat as provided by Opta while the orange line is one of my processed metrics.  The orange line represents the number of metres that the player dribbles the ball closer to the goal than from where they picked it up; so this shows how much progress towards the goal the player makes when carrying the ball.

These two dribble metrics follow a very clear and similar pattern, albeit a somewhat surprising one.  On the whole, wingers will dribble the ball less with each passing year.  Unlike the shooting and Key Pass metrics that we read about earlier in this piece, players do not carry the ball further or more often in their mid to late twenties than they do in their younger years.

To me, this is really interesting.  We have seen that wingers’ attacking output (as defined by shots and assists) increase from their early twenties until they reach 26 years old yet we see that they are carrying the ball less often and over shorter distances.  The median winger will have 1.1 successful dribbles when they are 26 years old compared to 1.6 when they are 20 or 21 but their decreased ball carrying does not seem to have an adverse impact on ultimately how creative they are.

One hypothesis for this is that they simply become smarter footballers as they mature.  They make better choices as perhaps they no longer feel that they have to prove themselves by beating their man like they did when they first broke into the team.  Perhaps they learn to lift their head and look for better options instead of simply carrying the ball for its own sake.

The takeaway from this discovery: So while we look at (for example) a 19 year old Raheem Sterling and marvel at his numbers we should bear in mind that, whilst his end product should increase until he reaches his mid-twenties, we should expect his ball carrying numbers to reduce.


Fouls Won

The purple line displays the number of fouls won or drawn by the median winger at each age of his professional life.  Although the line looks fairly flat on this chart there is a slight consistent reduction in fouls won from 22 years old (from 1.8 to 1.45 by the time the winger reaches 30).  Despite the existence of this slight decrease in fouls won as the winger ages it’s clear that the pace of decline is nowhere near as sharp as that shown in the main dribble metrics.  Once again, that’s an interesting result.

Does this suggest that it demonstrates players becoming cuter or more “game smart” as they develop in years because they can draw a foul comparatively easier (when controlling for how much they carry the ball) than when they were younger?  Or does it mean that fast players can’t or don’t win free kicks as often as we think they should?


Non-Corner Crosses

The last remaining line on the chart, the black one, shows us how many non-corner crosses the median winger plays.  There is a blip at 25 that otherwise distorts a fairly clear increase in the number of crosses wingers play until they reach 27 to 29 years old, after which point the output sharply decreases.  As the value of a cross is pretty marginal I’ll not spend any more time on this one but just wanted to mention it as I pulled the data to get to this point.


Forwards – Other Metrics

ForwardsOthers

No comment required here as the lines for the dribbling metrics and fouls won for forwards are almost a carbon copy of the wingers’ numbers produced earlier.  This in itself is encouraging as the emergence of similar patterns across two totally distinct data sets gives us confidence that there is signal in what we are looking at.


Conclusion

For most readers, this won’t be the first time they have read about Player Aging in football, and as a concept it is quite straightforward.  However, the reason that I undertook this research was that I was unable to quantify the impact that playing a 24 year old or a 30 year old player instead of a player at peak age (assuming both have achieved similar percentile achievements in their age bracket) for its position would have on a team’s expected output.

Balancing a squad from an age perspective is difficult; buying to improve your chances of immediate success will have a negative impact on your future chances and buying young talent to maximise resale value means that the team won’t be at their absolute peak for the forthcoming challenges.  It’s undoubtedly a tough line to walk successfully but now when teams make decisions around the age structure of their squad (here’s looking at you, Man City) we can be a little more knowledgeable around quantifying the potential impact of the decisions that are made.

Although the charts contained in this piece relate to the median number posted by each each group for each metric I also looked at the 80th percentile and, while the curves were obviously higher than the median ones, the drop off from the peak was roughly a similar amount to those displayed here.

Based on the data that I have analysed it looks like the peak age for a winger is 26, whereas a forward peaks a year or two later when they reach 27 or 28 and the expected impact of playing the 24 or 30 year old instead of your peak age player on an ongoing basis will shave approximately 2.30 goals from your attacking output over the course of a season.

Who Is Alexandre Lacazette And Should Arsenal Spend £40m On Him?

$
0
0
lacazette

lacazette

Since his 27 goal explosion in 2014-15, Alexandre Lacazette has been linked with numerous big clubs over a move from Olympique Lyonnais, with the latest being Arsenal. Similar to Thierry Henry insofar as he started as a winger and later transitioned into a striker role, with the alleged dearth of top class strikers seemingly available he’s been on the high on the list for big name clubs who need goal scoring reinforcements.  Only Zlatan Ibrahimovic has scored more goals over the past three seasons in Ligue 1 than Lacazette, and he’s been one of the starring members of Lyon’s rise back to being a force in French football. It’s been a quick ascension for the Lyon man and before Lacazette and Ibrahimovic, the last player to score 27 or more goals in a Ligue 1 season was Jean-Pierre Papin in 1991-92.

Scoring Data

Of course what will stand out with Lacazette’s resume over the past three seasons was 2014-15. The general football media tends to judge strikers on their goal output and a 0.9 goals per 90 minutes rate is a fantastic return in a top 5 league, especially playing on a team that isn’t full of star players. The problem though with judging strikers on goals even when standardized to a per 90 rate, is that penalties can inflate the total and Lacazette in 14-15 was a prime example. 27 goals look super impressive, but 8 of them were penalties which carry a near 80% conversion rate. Focusing only on his non penalty goals and his goal scoring rate drops to 0.6, which is still good and Ted Knutson a couple of years ago made a scale on where strikers were bracketed in terms of their NPG rate during the season. It’s still a nice little reminder to this day when looking at a striker’s production:

A fairly simple guideline for non-penalty scoring rates as a Forward is as follows:

.4 to .49 non-penalty goals per 90: Good.
.5 to .59 non-penalty goals per 90: Very good.
.6 to .79 non-penalty goals per 90: Probable Top 20 in Europe
.8 or above non-penalty goals per 90: Probable Top 5 in Europe

By that simple criteria, Lacazette’s goal scoring season was top 20 caliber.  Another thing to monitor is the quality of chances they’re generating, which is why expected goals has had so much fanfare. Of course it isn’t perfect as no single metric is, but by far it’s the best way currently to examine shot quality on both a player and team level. Here are Lacazette’s xG numbers along with his shot plot for all non penalty shots

Laca 4

credit goes to @SteMc74 for the data and shot charts

credit goes to @SteMc74 for the data and shot charts

Laca 2 A Laca 3

You can see a clear change from where he was in 2014 to where he is now, a change that ties in nicely with how Arsenal play football. The volume of long range shots that carry low goal probabilities have been replaced with poacher like opportunities instead. It’s also important to note that since becoming a central player he has over performed xG numbers every single season and has posted a non penalty conversion rate between 18-22%. The degree to which he beat them the first two seasons were never going to be replicated but there is enough evidence to present an argument that Lacazette is an above average finisher. In fairness he also has played in Ligue 1 which isn’t renown for sturdy goalkeeping so perhaps that helps a bit too. Regardless, his finishing ability might bypass some concerns about his shot volume not being quite up to a stellar level.

13-14

This was Lacazette’s first season playing mainly as a central player, often playing as a second striker of sorts next to Bafetimbi Gomis. Watching Lacazette at this time and you can see both the initial promise of what he would eventually become and the struggles of honing down a new position. There were games during the season where Lacazette played as an inside winger on either side of the flank, particularly when Lyon switched into a 4-3-3 shape whenever Jimmy Briand was on the pitch, but these instances were rather infrequent. Lyon even experimented with a 4-2-3-1 formation without Gomis versus Nice in the beginning games of the season where Lacazette a lot of times did play as the lone forward despite being listed as a RW.

Lyon weren’t a particularly good offensive team in 2013-14. They only scored 56 goals on the season which while ranking 4th in Ligue 1 is still a pedestrian output. Despite taking the 5th most shots in the league, their xG numbers were pretty poor too at only 1.09 per game. Watching Lyon’s buildup play and you can see why that’s the case, especially when it came to Lacazette trying to navigate playing with a more traditional striker. There would be numerous times where Lacazette would call for the ball to be played to his feet so he could run at defenders with speed, only for that pass to not be selected and instead shifted out to the fullbacks.

The end result a lot of times would be a cross intended for someone like Gomis to get on the end of it,  a low percentage chance at best. Whenever Lacazette did get the ball, the quick hitting 1-2 combinations rarely materialized, often it’d just be a pass back to someone like Clement Grenier and the tempo would stall. It can be argued that the side was more tailored towards Gomis and Grenier while Lacazette was just there as a secondary figure. Lacazette had a tendency whenever Gomis was occupying the middle to shift out to a wide position and just stand there with little movement. On occasion Lacazette would gather the ball from the left wing on a fast moving attack and his first extinct would be to find Gomis with a cutback pass.

Having said all that, there were moments where you could see the type of close control and body shifting that would make him the key figure at Lyon in future years. The ability to shift and juke opponents in tight areas whether it be 45 yards from goal or just outside the penalty area were exquisite. Also for a guy who’s listed at around 5’9, his lower body strength already was quite impressive as he could hold off defenders when receiving a ground pass with his back to goal.

Overall, given the circumstances both on the field and Lyon’s financial difficulties in general, turning Lacazette into a striker was a victory for Lyon which would pay big dividends going forward.

14-15

The season that made Lacazette a household name featured a different cast of characters from the previous season. With Remi Garde departed, Hubert Fournier took over and Nabil Fekir and Clinton N’Jie became important members of the squad. Christophe Jallet was the everyday RB while Grenier and Gueida Fofana were injured for the majority of the season. Yoann Gourcuff was still there but in typical Gourcuff fashion, he played less than 1000 league minutes due to an assortment of injuries.

Perhaps the biggest change rebuilding the attack having seen Gomis move to Swansea. It allowed for Lyon to start playing Fekir in his spot instead which combined with Jallet’s inclusion shifted the club to an even more ground based attack that incentivised cutbacks and discouraged long traditional crosses. This suited a striker like Lacazette and although the early results weren’t quite there yet for Lyon it looked better than it did for major parts of the previous season.

There were games where Lacazette was held in check, notably in their matches against Olympique Marseille. The unorthodox man-to-man oriented press employed by Marcelo Bielsa disrupted Lyon’s passing game, and thus made Lacazette more of a peripheral figure. While not employing the same pressing methods, similar results occurred versus PSG and Saint Etienne. The Marseille fixtures in particular were noteworthy because it forced Lyon to add a new wrinkle: to use fast moving counter attacks.

That new dedication to playing faster when the opportunities arose made Lacazette look like an irresistible force during numerous games. His hat-trick versus Lille, two goals against Caen and a host of other performances in the first half of the season profited from the added creativity around him paying huge dividends. This is the perfect illustration of how devastating Lyon were at time on the counter.

There were still lingering issues with Lacazette’s play even with the gaudy goal totals. He struggled against teams with a low block defense in the 2nd half of the season and he was certainly running hot as evidenced by vastly outpacing xG numbers to that degree. Still, Lyon emerged as surprising contenders for the Ligue 1 title alongside Marseille, taking PSG to the final weeks of the season while getting themselves back into the Champions League group stage for the first time since 2011-12. Alongside Nabil Fekir, they emerged as the best forward duo in France that season and the future seemed bright. European football was on the horizon and a new stadium was to open in January 2016. Lyon could hope to rebuild back to their previous heights.

15-16

French football can take credit for the fact that they develop prospects relatively well. As a result their national team is stocked with future young talents for perhaps the next 10-12 years. One thing it isn’t good with domestically is that as a result of finances, Ligue 1 clubs (bar PSG) have a pretty hard time keeping squads together for multiple seasons. One only has to look at what’s happened to Marseille or Monaco over the past couple of summers and to see an illustration of that.

So it was a really big deal that Lyon kept the majority of their squad ahead of 2015-16. After the seasons they had, it would’ve been very easy for them to sell super high on Fekir and/ or Lacazette like they did with Clinton N’Jie. However Lyon inked numerous players to contract extensions, kept hold of the striker duo, and with their newfound finances they even added to the squad. Lyon bought Mathieu Valbuena, Sergi Darder, Claudio Beauvue in addition to other signings in an effort to have greater squad depth for juggling Ligue 1 and European Football. There were even hopes that Lyon could replicate their 2014-15 form and put another scare into PSG’s domestic dominance.

However there were issues with that recruitment. Valbuena had been a good Ligue 1 player during his time at Marseille, but his fit at Lyon was at best questionable. His best gifts as a playmaker involved set piece deliveries and crosses from the halfspace towards a taller target, which didn’t fit Lyon since Lacazette’s transition to becoming the only traditional striker. In many ways he would have been a better fit on the Lyon sides of 2-3 years ago. Beauvue also had his issues trying to be the striking partner in the 4-4-2 diamond and settled so badly, he eventually ended up departing to Celta Vigo in January. You add those things together alongside the devastating knee injury to Fekir in early September, and you have a recipe for disaster which befell Lyon during the first half of the season. Lacazette suffered during this period too, most notably with back issues, and scored only 6 goals prior to the winter break including a hat-trick versus Saint Etienne.

Lyon made several changes during the winter break: they fired Fournier and hired Bruno Genesio as manager, switched to a 4-3-3 formation which allowed Rachid Ghezzal and Maxwel Cornet to emerge thus easing Valbuena off of the starting XI, and subsequently took off again: suring the second half of the season they were behind only PSG with the second most points and goal differential in Ligue 1. Fitness and form regained, it’s here where we see the current and desirable version of Lacazette as a player:

  • Version 1.0: A young second striker learning the ropes with clear talents but settling for impatient shots
  • Version 2.0: A counter attacking machine with more nuance to his game but struggles still against certain defenses.
  • Version 3.0: A goal poacher with improved link up play + movements, less reliance on counter attacks to generate quality chances but still really good at it, and a much better sense of when and where to shoot.

Of his 21 Ligue 1 goals in 2015-16, none of them came from outside the box and many of them came from making straightforward runs or even snatching up rebounds. The art of the striker: being at the right place at the right time. Lacazette came full circle as a player with his hat-trick versus Monaco in week 37. Billed as the game to decide which club qualifies straight into the Champions League group stage, his three goals capped Lyon’s 6-1 thrashing and were brutally efficient, a contrast to previous hat-tricks where the aesthetics were considerably higher.

It wasn’t quite the season he imagined, and despite his goal scoring streak in the 2nd half it wasn’t enough for him to make it to the Euro 16 France roster, but Lacazette’s stock has still never been higher, and nor has his price tag, now thought to be in the £40M range.

Conclusion

Alexandre Lacazette has become a very good goal scoring striker who year after year has improved in noticeable ways, whether it be his general link up play or his ability to shoot from better areas. It’s also helped that this rise has coincided with Lyon’s improvement as a club offensively over the same duration span and a growing diversity in their attack. As the team has got better around him, it’s helped spur his evolution as a striker from a inefficient shot taker to a ruthless finisher. There are some questions surrounding the quality of fit that he’d be to Arsenal, given obvious differences in style to Olivier Giroud or similar types, but it also should be said that Lyon have evolved in a way that somewhat resembles what Arsenal, which can be seen both visually and the in the growing centrality of their shot selection in the 18 yard box.

If we highlight concerns with Lacazette, his shot numbers over the past two seasons have plateaued around 3 shots per 90 minutes, which is fine but a way off the rates of the truly elite strikers in Europe, though maybe that can be partly explained by Ligue 1’s slower pace as a league. Size could be a bit of an issue if he does go to the Premier League next season, though judging by the success of very recent Ligue 1 imports to England maybe that’s really nothing to worry about. The Premier League hosts perhaps the best stable of goalkeepers in the world and it’ll be a better barometer as to how good of a finisher Lacazette truly is. If his finishing skill is genuinely in a higher echelon, then the shot generation concerns will subdue.

But will he move? It’s entirely possible that he’ll spend another season at Lyon, their financial crisis is a thing of the past and while no one would confuse them for PSG, they can go back to the smart player trading that made them 7 time league champions during the 2000’s and a perennial Champions League knockout stage participant. Whatever the future holds, and whichever team ends up with Alexandre Lacazette, they are looking at a 25 year old striker landing in his peak who has shown a consistently high goal output over three years. Arsenal missed out on Jamie Vardy, but can they afford to ignore their pressing need for striking reinforcements? Reports today suggest Lacazette is keen to leave and he could well be the answer for Arsenal.

Someone tell Arsene.

Twente’s One Pilot: Hakim Ziyech

$
0
0
2015-08-15 00:00:00 ENSCHEDE, FC Twente - ADO Den Haag, Eredivisie , Voetbal, Stadion Grolsch Veste, Seizoen 2015 / 2016, 15-08-2015, FC Twente speler Hakim Ziyech scoort de 1-2, doelpunt.

2015-08-15 00:00:00 ENSCHEDE, FC Twente - ADO Den Haag, Eredivisie , Voetbal, Stadion Grolsch Veste, Seizoen 2015 / 2016, 15-08-2015, FC Twente speler Hakim Ziyech scoort de 1-2, doelpunt.

In the Dutch media, Hakim Ziyech has come to be known as ‘Hakim the Silent’. Since the start of 2016, he no longer attends press conferences or interviews of any sort; Ziyech and his agent feel they do not want his comments to be misinterpreted, leading to a vilification of the player in the media. After all, that was what transpired after Ziyech, the then-captain lashed out publicly at essentially everyone associated with the club, following the sacking of Alfred Schreuder (he was soon stripped of the captaincy). Barring some social media activity now and then, Hakim Ziyech remains a bit of an enigma off the field.

He has let his on-pitch performance do the talking mostly and there Ziyech has been anything but enigmatic.

Hakim Ziyech’s two years at Twente have probably turned out both the way he wanted and not the way he wanted. On a personal level, the Dronten-born midfielder has seen amazing growth in his skills and ability to influence matches. However, this has all taken place on board the Twentitanic, a rapidly-sinking ship hit by the Doyen controversy iceberg last season off the pitch and a floundering ghost of a team on the pitch. Ziyech has been the band that continued playing even as chaos erupted and consumed the ship.

For the most part of the last two years, Hakim Ziyech has carried the Twente team. In moments of defeat and debility, the Moroccan has been the one that everyone looked to for a spark, for a way back into a match.

Naturally, the centrality of Ziyech to Twente as a club directly translated onto the pitch. The fact that his teammates depended on him to deliver so much meant that he got freedom in his movement and decision-making on the ball. A ‘true’ No. 10 in an era where playmakers are increasingly expected to be multifunctional, Ziyech filled the void of creativity left by Dusan Tadic, who albeit operated from the left wing. The 23-year-old occupies a central role just behind the frontline, but as many attacking midfielders do, often finds himself playing further forward, in line with if not ahead of the striker. Ziyech is equally smart when there is space behind the defence, as well as in tight spaces, when defenders are closing him down.

While extrapolating from one performance is not ideal, a game that really showcased Ziyech’s ability as the main man, came in a heavy 1-4 defeat to ADO Den Haag a year ago.

L: Ziyech's pass map vs ADO Den Haag; 79 passes completed, 56 of which went forward R: Ziyech's touch map, showing his influence in halfspaces

L: Ziyech’s pass map vs ADO Den Haag; 79 passes completed, 56 of which went forward
R: Ziyech’s touch map, showing his influence in halfspaces

ADO took the lead quickly within the first half hour, and as Twente looked to pick themselves up, they looked to Ziyech. The Moroccan had the most touches — 103 in total — and most of these came in the halfspaces (as seen in the touch map), which is the area between the flanks and the centre, if the pitch is divided into 5 equal parts, lengthwise. Operating in this region gives the player the opportunity to play a forward pass over a backward pass as well as being more decisive in moving the play forward. The freedom that Ziyech is afforded in his #10 role is thus well-expended in such a way, since 56 out of the 79 passes he played went forward to a teammate.

The Twente No.10 floats all across the pitch, although his decisive actions tend to come more from the halfspaces. In general, this makes marking Ziyech difficult; PEC Zwolle’s Wout Brama acknowledged last season that trying to man-mark the slender midfielder was an essentially futile endeavour.  Furthermore, Ziyech has consistently put up some of the highest numbers for key passes in every full season he has played in the Eredivisie, since making the step-up from youth/reserve level.

Screen Shot 2016-08-18 at 11.10.12

Putting up good assists and/or key passes numbers as a young player generally bodes well as an indicator of the player’s potential and ceiling, as Ted Knutson detailed. To quote Ted, “(The skill of young players producing high number of assists) is the modern attack. You need creative guys who can run make runs, fill space, and have the vision to produce great final balls. Pair them with efficient finishers, and the combination makes it exceptionally difficult for teams to mark you in the attacking third.”

This is the type of player Hakim Ziyech has proven himself to be, especially over the last year in the Eredivisie. Even from his days at Heerenveen, there were comparisons (premature then, but somewhat valid) to Mesut Özil and now, it is not too far-fetched to liken Ziyech’s skill on the ball to the German; his control of the ball even when dribbling is impressive and his passes are often well-weighted, if not silky.

ziyech_15-16_720

In addition to crosses, a large portion of Ziyech’s key passes come from set pieces, with his corners in particular being a strong point. His awareness of space is fantastic, as shown before. In 2014/15, Ziyech had relatively better teammates in Jesus Manuel Corona and Renato Tapia, who were in sync with the nimble-footed midfielder and each found themselves on the receiving end of a Ziyech assist four times over the season. But even when these two departed for greener pastures as the Twentitanic started sinking, Ziyech continued creating. This is highlighted by the fact that his key passes numbers have increased between 2014/15 and 2015/16, even though the assist tally went down. Such fluctuations are rarely the fault of the creator and the growth in the key pass metric from an already high level is an encouraging trend.

Ziyech is the type of player who finds it second nature to change direction quickly and flummox defenders. His light frame gives him mobility and he accelerates just as smoothly with the ball as he does without it. Over the last three seasons, he has attempted an average of 4.7 dribbles per 90 minutes, and finds success roughly half of the time.

As such, when his teammates aren’t finding the target enough, Ziyech is more than capable of taking the mantle himself. Being the focal point of his side, in every sense of the term, means that Ziyech takes a lot of shots, from both open play and freekick situations. He also finds the target pretty consistently, with a percentage of 41.3% of his shots being on target over the last two seasons. With a propensity to shoot from range, he lags a bit in terms of actual conversion, but in a side with better teammates and with more guidance, he should develop a more keen sense of picking his shots well. There is a certain unpredictability about Ziyech, which is what also makes him lethal; he can seem quiet but then suddenly emerge in a good position and find a goal or create an opening for a teammate. That he could produce such moments with some regularity over the last season is impressive.

Screen Shot 2016-08-18 at 11.06.01

Ziyech’s glaring weakness is his physique — or rather, the lack thereof. While his balance is good, being fleet-footed can’t always get the 23-year-old out of trouble and at times, this can lead to him losing the ball when he attempts a dribble and ends up being outmuscled.

However, with enough strength and conditioning work, this should not be a major obstacle in preventing clubs from being interested in him. Riyad Mahrez, for example, showed last season, that one does not necessarily need to be of bulky build to succeed as a winger or creative midfielder in a league as renowned for being physical as the Premier League.

As far as his best position goes, there is very little space for discussion. As Ajax boss Peter Bosz put it, “Ziyech should not be played on the wing. He belongs at the #10 role; he’s a creative boy who does not belong on the flanks.” The midfielder himself is obsessed with everything #10, he even has it stitched into his gloves. He is not the type of player who would thrive in a tactically rigid role; growing up playing football on the streets, Ziyech is an effervescent attacking presence but can only perform as such if he is given the tactical freedom to dictate play.

Ziyech might also take his time to develop into more of a team player, which has some irony in as much as the reason for him seeming ‘selfish’ at Twente was in taking up responsibility in situations of need. Naturally, if/when he moves to a bigger club, he will have teammates of better calibre and thus, he will have to refrain from trying to do everything himself and sometimes taking that too far. Most teams also expect attacking midfielders to be multi-functional and help out in defending and pressing, and this too is an area Ziyech should look to improve and develop in.

However, the fact that we are well into August and Ziyech still plays for Twente (who were nearly relegated over the summer due to their financial irregularities) remains almost a Tupac-level mystery now. There has been interest from some foreign clubs, while PSV and Ajax have made enquiries too. The Dutch clubs are likely to be priced out by the €12million ‘base’ fee price tag that Twente have slapped on him. All of Borussia Dortmund, Roma, Fenerbahce, Inter Milan, Napoli, Burnley and Everton have been linked to the 23-year-old at some point over the last few weeks — the first three being named by Twente director Ted van Leeuwen himself as clubs willing to pay the minimum fee.

It is possible that Ziyech himself is waiting for a ‘big’ club to show real, concrete interest, hence perhaps why reported talks with Burnley were unsuccessful. Most of the other clubs should be of sufficient level for Ziyech to benefit from the move as a player, though naturally he will have to go through the adaptation and acclimatisation process before producing performances of the calibre he showed in the Netherlands.

Given the ridiculously high fees thrown around this summer, the club who eventually picks up Hakim Ziyech for the peanuts sum of €12m or so, might prove to have made a shrewd investment.


Scouting Ligue 1: Bordeaux’s Adam Ounas

$
0
0
Bordeaux's Senegalese forward Henri Saivet (C) celebrates after scoring a goalBordeaux's French midfielder Adam Ounas runs with the ball16, 2015 at the Matmut Atlantique stadium in Bordeaux, southwestern France. AFP PHOTO / NICOLAS TUCAT / AFP / NICOLAS TUCAT        (Photo credit should read NICOLAS TUCAT/AFP/Getty Images)

Bordeaux's Senegalese forward Henri Saivet (C) celebrates after scoring a goalBordeaux's French midfielder Adam Ounas runs with the ball16, 2015 at the Matmut Atlantique stadium in Bordeaux, southwestern France. AFP PHOTO / NICOLAS TUCAT / AFP / NICOLAS TUCAT (Photo credit should read NICOLAS TUCAT/AFP/Getty Images)

It’s almost become a mini tradition within Ligue 1: over the past couple of seasons a young attacking player between the age of 18-22 makes a leap towards mainstream stardom with a highly successful season. 2014-15 was Nabil Fekir under a resurgent Lyon. 2015-16 was Michy Batshuayi under a floundering Marseille and Ousmane Dembele with Rennes. Before that were the likes of Pierre-Emerick Aubameyang and Eden Hazard, players who have gone on to become international stars at Dortmund and Chelsea respectively.

Ligue 1 has gained the reputation for being a league where high upside players can be had for affordable prices. Because of the wayward finances of some clubs in France and having to abide by the rules of DNCG, there have been instances where pretty talented players have been sold for rather cheap prices. Dembele for example went to Dortmund this summer for only a reported 15M despite some signs that he could be a genuine top tier player going forward. You would think that level of hype would demand a higher transfer fee but combine the factors of Rennes not being the greatest financially and limited time remaining on his contract and what you got was a value fee.

Adam Ounas from Bordeaux could be the next one to join the list. In his age 19 season, he produced 0.44 goals per 90 which isn’t too shabby a rate on a club that was managed by Willy Sagnol, who from all accounts looked overwhelmed at the position. Highlighting the next exciting attacking player is not an exact science but let’s give it a shot:

Is he a shot monster? Well he shot 3.1 times per 90 as a winger at age 19 so that’s promising.

Are those shots coming from good locations? Well not quite but some of the shots that are inside the box are higher quality so there’s something to work with.

ounas-1

Can he dribble? Well 6 attempted dribbles per 90 at least tells us that he tries a lot to run at them

How about as a playmaker? Nothing of note really yet but forgivable seeing as he’s still 19 on a mediocre Ligue 1 side

ounas-2

How about his decision making?

Well let’s get to that.

So here’s the thing. Adam Ounas profiles quite well statistically especially considering Bordeaux are a club without a recognizable star like Lyon have or being on a super team like PSG are. As a shot taker, the ability to create semi decent shots consistently is a skill and to this point Ounas’ skill set would dictate that he can grow into being that type of player. Taking over 3 shots per 90 and accumulating a decent xG90 rate is promising stuff, and again, he’s only 19. This is the type of profile as a team you would love to get cause the upside is massive.

But yet I can’t shake off this feeling of not totally being in love with him despite the numbers. To be clear, Ounas is a very talented prospect but perhaps it’s the amount of times he settles for long range screamers or how many times he would cut into the final third with throughball opportunities or opportunities to recycle possession, but ignore them. While the talent is massive, I don’t think he uses it anywhere near as efficiently as he could. Some of it is due to environmental factors surrounding him (poor coaching, shaky roster etc..), some of it is also due to him being 19 years old, but it also as well comes down to a probable contrasting idea of what a good shot is versus what isn’t.

Good

There’s the old saying of players being worth the price of admission because of how electrifying their dribbling can be. Dembele last season was the perfect example because he made fools out of everyone last season, plus those dribbles at times led to him either creating good opportunities for himself or for his teammates. While Ounas isn’t quite adept at doing the latter, his ability to shift and juke past multiple defenders is quite frankly fun as hell to watch:

There’s a value to be had for a winger who can constantly get his team from the middle third to the final third by himself. With a better attacking structure, this can lead to creating high quality chances on enough occasions that it would become a massive boost for a club. Hazard was arguably the best player in the PL in 2014-15 because of his insane ability to do one man dribbling crusades into the box and create for others. Riyad Mahrez won plaudits for his ability to do both that and also be a threat to shoot. Ounas right now is somewhere in between: he can get into the box decently enough but it’s mostly for him to shoot first and pass second.

Where he thrives as with most pacey attackers is in transition. There are very few players in Ligue 1 who can keep up with him in non structured scenarios even if his decision making isn’t quite there yet.

This is Adam Ounas at his best. Even if it’s not always efficient, the volume of these opportunities can tilt the scale towards his favor.

Bad

The same ability to create a shot out of very little can be Ounas’ worse enemy as well. Take for instance this play

ounas-3

Now yes, a throughball pass to Khazri could very well end up being a shot from the wide space of the penalty area or even a cross. In the hierarchy of throughball chances created, this would be much lower down. But still that opportunity carries a considerably higher chance of something good happening than just launching a shot from Ounas’ location. Those type of distance opportunities get connected at around a ~3% clip. So what happens?

Oy Vey!

Now if this was something resembling a one off then it would be fine enough. The very best teams in the world can create systems where they can repeatedly take good-great shots and well, he doesn’t play on one of those teams. As an inverted wide man on a Ligue 1 club with very little attacking structure, that role can at times lead to wayward shots. The thing is that these moments aren’t few and far between and games featuring Ounas have these groan inducing shots. Here’s another example:

ounas-4

In fairness, there isn’t much in the way of throughball opportunities here as Lyon congest the pitch. Really there’s only two options: recycle the ball to a nearby teammate and continue to probe for a better opportunity (which does carry the risk of nothing good ever emerging) or pray that a shot in that scenario does anything of worth. What happens here?

It’s situations like this that give you a greater appreciation for teams who train their players to value possessions and not give defenses an out, especially defenses that generally defend deeper. Ligue 1 is a league where generally teams defend with lower blocks so what they’re looking for is crosses from further out and bail out shots like this. The more teams probe around and carry the threat of goal, the better. Of course there’s a billion factors that go into being able to construct that type of offense but the point still stands. I would also guess that Ounas is also one of numerous players who have a higher opinion of the probabilities of these type of shots going in. Soccer in the end of the day is about probabilities; the more times you can create high quality chances, the better chance you have in winning. Instances like this don’t help with that.

How he stacks with his peers

The obvious comparison is with Nabil Fekir, both in terms of their body composition and their general style of play. Both are left footed who in a perfect world like to cut into the middle all the time. It can even be argued that when it comes to athleticism, Ounas has an advantage over the Lyon starlet. During Fekir’s breakout season, he got to play the majority of it as a second striker which allowed him more freedom to roam around and dictate at his pace. He’s more cerebral than Ounas and used it to maximize his shots from open play. At times it feels like Ounas is just rushing possessions for the sake of it, ending up with 23 yard shots that had minuscule chances of going in.

It can’t be denied though that there is also statistical merit towards the comparison between the two. In fact, even with all his flaws in structured scenarios, Ounas production stacks up quite well compared to some of the young attacking talents that have plied their work in France over the past two seasons:

Players Minutes xGxA p90 NPGA p90 Shots p90 xG per shot Dribbles p90
Fekir 14-15 2877 0.51 0.69 2.75 0.11 3
Carrasco 14-15 2922 0.45 0.49 2.34 0.09 2.71
Silva 14-15 2390 0.43 0.45 1.28 0.19 1.51
Batshuayi 14-15 996 0.67 0.81 3.25 0.19 1.9
N’Jie 14-15 1603 0.61 0.79 2.75 0.16 2.13
Dembele 15-16 1702 0.53 0.85 2.85 0.12 4.87
Ounas 15-16 1241 0.45 0.44 3.12 0.09 3.19

It’s an accomplished list. Fekir looked like a budding superstar before knee problems got in his way, Carrasco has gone on to do well with Atletico Madrid, and Dembele was the brightest thing in Ligue 1 last year before hitting the jackpot by going to a manager like Thomas Tuchel. Plus, this list doesn’t even include the likes of Thomas Lemar and Maxwell Cornet, who so far profile quite well going forward. The only player in this list who has the potential to not look so great is N’Jie and even his development since leaving Lyon could be explained away through unfortunate timing, injury, and now having to play for the worst Marseille side in decades. It’s a credit to his talents as a player that Ounas can produce this level of results even if the process behind it isn’t the most cerebral.

It is interesting that in his first two starts to the season, Ounas played much more on the left side in something resembling a 4-4-2/4-2-2-2, a staple of new manager Jocelyn Gourvennec. Playing a naturally left footed player on the left side does eliminate some of the bad habits of taking the type of bad shots that have made Andros Townsend a household name, but it could also make it hard to get traction in the middle of the park and Ounas’ crossing isn’t really a strong suit. To this point it’s been a mixed bag: an encouraging performance versus Lyon but an infuriating one against Angers a week later.

Conclusion

In relation to players such as Batshuayi or Fekir, Adam Ounas is possibly more of a risk. There are a lot of rough edges to his game but  he’s not turning 20 until November and to this point has not even played 2000 career Ligue 1 minutes. Plus, with all due respect to Bordeaux last season, he didn’t play with a lot of talented attacking players. This time around they’ve signed attacking talents like Francois Kamano and Jeremy Menez alongside an accomplished passer in Jeremy Toulalan so that excuse can’t be used. Plus, their January signing in Malcom so far this season looks like a genuine talent. The hope for both him and the club is perhaps with the elevated talent and better structure, it can lead to more opportunities for higher quality chances which in turn will produce results.

There are a number of talented wide players who if you could fix their shot locations to an acceptable amount could become stars. Ounas is one of the poster boys for that. His gifts technically are superb but they go to waste when he settles for hopeful shots. The good thing though is he’s young enough as a player where he could absorb the teachings of coaches who tell him to knock it off with some of his habits. If he can find a happy medium between creativity and efficiency, Adam Ounas could be the next Ligue 1 starlet.

Memphis Depay: Why it hasn’t worked out at Man United

$
0
0
MEMPHIS3

When Memphis Depay signed for Man United in the summer of 2015, he was one of those rare prospects that while unproven, seem certain to succeed. He’d broken through in the Eredivisie the previous season, posting stats impressive enough for Ted Knutson to call him:

“One of the best young talents in Europe… I’ve looked at quite a bit of data on young scorers and how they develop – I’d say it’s better than 50% odds that he will sell for £45M at some point later in his career.”

In his last year in Holland, he led PSV to the Eredivisie title, and became the first option off the bench for a national team that started Robin Van Persie, Wesley Sneijder and Arjen Robben as its front three.

More than a few people called him the “next Cristiano Ronaldo”.

Things haven’t worked out. In fact, it’s hard to think of any player whose stock has fallen as dramatically as Depay’s over the last year and a half. Looking back at his enormously successful last season at PSV, is there anything that could have tipped us off to Depay’s struggles at United?

Well, one thing that sticks out is his sky-high usage rate.

Usage rate is the percentage of a team’s possessions ended, or “used”, by an individual player. Possessions aren’t as easy to define in soccer as they are in basketball, but using detailed event data, you can break a match into a series of distinct possession chains. The last player on each chain is the one that’s “used” the possession. See below:

POSSESSION CHAINS

In his last season at PSV, Memphis had a usage rate of just under 19% – the highest in the league. The next highest[1] was Adnane Tighadouini (17%), who played for NAC Breda and was splitting possessions with guys called “Remi Amieux” and “Sepp de Roover”…

Depay certainly put up exceptional counting stats in in 2014/15 – 0.85 NPG+A/90 – but they lose some shine if you consider that when he was on the pitch he was using almost 20% of PSV’s possessions. By comparison, his teammate, Georginio Wijnaldum, had a usage rate of 8%, and racked up 0.55 NPG+A/90.

Memphis – prolific, yes, but inefficient.

And if you dig into the possession data a little more, that argument holds…

There are three basic types of attacking possession:

  1. Set pieces start with corner or a free kick. The most effective type of possession – 2.7% of these end in goals [3].
  2. Open play possessions are when a team forces an open play turnover and can attack immediately without any stoppages. They’re the most common type of possession. They end in a goal 1.4% of the time.
  3. Set defence possessions start after stoppages, such as throw-ins or kick-offs. They’re about half as common as open play possessions and also half as effective[4].

Untitled-12

Depay’s usage rate was just above average when it came to the low value “set defence” possessions (13%), but he made up for it by using a greater share of the higher value set piece (23%) and open play (20%) possessions. That’s incredibly high for a wide forward, especially, for one on a counter-attacking team. It was the result of a concerted effort by PSV’s midfield to get him the ball – Depay was the most common pass recipient for each of PSV’s 3 main midfielders, Wijnaldum, Andres Guardado and Adam Maher.

When he moved to Man United, it was a different story. The season before, Ashley Young, and Adnan Januzaj split minutes in the left forward position. Different types of players, but all relatively low usage. So substitute a high-usage playmaking hub like Memphis in for the guys just mentioned and what happens? Where do the extra possessions come from? Who is donating to the Depay cause?

Um… No one.

There are a limited number of possessions to go around. At PSV, Memphis was the star man and preferred option. At Man United, he was splitting possessions with Anthony Martial, Juan Mata and Wayne Rooney, (and even guys like Matteo Darmian and Marouane Felliani soak up more than their own fair share). From day one at Man United, Depay’s usage rate almost halved – 12% on those important open play possessions, compared to 20% the season before. Now, there are other reasons Memphis struggled in the Premier League, but in a very basic, quantifiable way, he’s had less to work with.

At PSV, Memphis put up elite numbers at a very young age and looked like an all-world prospect. What those numbers didn’t account for was the massive number of possessions he was using, (particularly when compared to other players his age). Memphis might have been an upgrade over Ashley Young and the rest of the players who filled out Man United’s left forward rotation in 2014/15, but his high-usage brand of football didn’t fit in a team stocked with big name attackers.

Depay isn’t the only one who’s run into this problem. Paul Pogba initially struggled to establish himself in United’s attack. It’s only since being paired in midfield with the low-usage Ander Herrera and Michael Carrick that his form has improved. Carrick, in particular, is incredibly efficient; when on the pitch he uses just 6% of United’s possessions. And the chief beneficiary is Pogba – in games where Carrick starts, the Frenchman’s usage balloons from 12% to 18%. Just like PSV’s midfield fed the ball to Memphis, Carrick feeds Pogba. The Frenchman is by far Carrick’s most common pass recipient this season. Against Crystal Palace, Carrick completed 21 passes to Pogba! And Pogba created 4 chances, and had 4 shots, 1 goal and 1 assist. United won 2-1.

My point is, it’s not that these high-usage guys are bad, but they can be hard to fit, and if you want them to succeed, you need to carve out a space for them. The question that follows Memphis to Lyon is where will his possessions come from?


N.B. – here’s how I’d answer that:

Lyon Usage Rates 2016/17 (over 500 mins)

NAME POSITION USAGE RATE
Nicolas NKoulou Defender 3
Maxime Gonalons Midfielder 6
Mouctar Diakhaby Defender 6
Mapou Yanga-Mbiwa Defender 6
Sergi Darder Midfielder 10
Jeremy Morel Defender 11
Jordan Ferri Midfielder 11
Mathieu Valbuena Midfielder 11
Rafael Defender 12
Nabil Fekir Midfielder 13
Maxwel Cornet Forward 13
Alexandre Lacazette Forward 13
Maciej Rybus Defender 13
Corentin Tolisso Midfielder 15
Rachid Ghezzal Midfielder 16

Lyon have a solid base of low and mid level usage players to build on. The standout is, of course, Maxime Gonalons, in a Carrickesque role to Corentin Tolisso’s Pogba. Tolisso’s is high usage, but the problems lie more with the other guys on his end of the table. Maciej Rybus and Maxwel Cornet probably aren’t probably aren’t giving Lyon enough for what they’re taking away, so I’d play them less and Jeremy Morel and Sergi Darder more. Also, Rachid Ghezzal is doing well, but it would probably suit both him and Depay if they didn’t play together too much…


[1] Among players who played over 1000 minutes

[3] 3.3% of the time if you include penalties

[4] They become goals 0.8% of the time

Joshua King and the Hot Foot

$
0
0

king pic2

Joshua King scored sixteen goals in the Premier League last season for Bournemouth. His contributions went a huge way towards securing their 9th placed finish. He has now been linked with a big money move and a fee of around £30m is being suggested.

Playing in various attacking midfield or forward roles, the 2016/17 season was a big step forward for King, after having taken time to find his feet since leaving Manchester United’s youth system in 2013. A spell at Blackburn enabled him to play first team football and led to his move to Bournemouth in time for their arrival in the Premier League. Now 25 years old, he will feel he has made his mark, and a move back up the ladder would represent a huge step. But beyond the headline number of the 16 goals, is there anything else we can glean if we analyse his output. Should clubs be taking a chance on him repeating this form, or should they be more circumspect and hold fire? Let’s take a look.

Conversion

First thing to note is King took three penalties last season and scored twice. This means for analysis purposes, he scored 14 non-penalty goals. The top line here is that those 14 goals came from 64 shots, the majority of which were with his right foot (44). That represents a conversion rate of over 20% which is on the high side compared to a league average of all shots nearer to 10% and in the knowledge that even prolific strikers rarely land over around 17% on a long term basis; the poacher type such as Miroslav Klose may well get higher. He only took six headed shots from which he did not score, so all his threat came from shots with his feet.

As a starting point for analysis, that high conversion rate looks like a hot goalscoring season that may contain elements that are unlikely to intrinsically recur. But in the first instance, that’s just a presumption. Can we identify whether his season was more of an Aaron Ramsey 2013-14 (10 goals from 50 shots, has not repeated) or something more apparently sustainable like Luis Suarez (has converted his shots at a rate of 17% (Liverpool), 21%, 24% and 28% over the last four seasons)?

Expected Goals

josh king shots 1617

Now goals are only one aspect of King’s play, but it’s the headline act and the primary reason he is attracting wider interest. The next logical step here is to take a look at his expected goals. The top line is that he scored 14 goals from an expected rate of 8.6. So here we have some confirmation that the insight gained from his goals to shots rate is supported by adding in locational factors (and more). That discrepancy in itself does not offer us insight into how his goals occurred or whether the simple overshooting of expectancy is a product of skill or luck. Plenty of other players overshoot estimations, and do so every season.

During the last four seasons in the Premier League there are 564 instances of a player recording twenty or more non-headed shots in a single season. On a per shot basis, Josh King’s 2016-17 season ranked 14th of 282 that were overperforming goal expectation, so very much at the high end.

josh king buckets

What can we deduce here? Firstly, in 2016-17 he scored three goals from 26 shots with an expected goal value of below 0.05. This can happen, but logically isn’t something that you might presume will continue. When shots with an estimation of one in twenty are going in at a rate of one in eight, it’s far enough out to be notable. Saying that, he was one for 25 in the 0.05 to 0.20 range which means for the entire low probability range he scored four times rather than an expected three. This is well within the realm of normal expectation and considering he went 3/50 in 2015-16 on similar shots, also shows some consistency.

Big and bigger chances

The real action comes from the higher end. Everything from 0.30 upwards here is a designated “big chance” and King holds an apparently impressive record of having scored ten from thirteen attempts (77%). However, this positive return can be tempered by looking at a comparison. Within the Premier League over the last four seasons, there are twenty occurrences of players scoring ten or more non-penalty big chances within a given season. No other player has recorded a conversion rate higher than 71.4%. Conversion rates notoriously fluctuate and King is away and clear at the top end of positive variance.

We can bounce it out to the big five European leagues over the same period, and we find his season ranks 2nd highest of 117 players on a per shot basis (behind only Gareth Bale in 2015-16, who converted 11 of 13 big chances). King may be keeping good company, but the overriding likelihood is that he has enjoyed a hot streak. Over a larger sample, no player finishes above a rate in the his fifties (Alexis Sanchez is on 57.5% on 73 attempts), so when we add in 2015-16, King remains significantly on the high side:

big chance conversion

The idea that his goalscoring run is most likely a streak is enhanced when we split the season. Prior to New Year’s Eve, King played 1206 minutes in the league yet acquired just two big chances, both of which he missed. Between New Year’s Eve and the end of the season, he played 1505 minutes and was credited with eleven big chances of which he scored ten, the only miss coming from a left footed shot from a through ball against Middlesbrough. Can King continue to gain high quality chances at this new rate? That’s hard to answer, but over time his ability to finish them will surely reduce.

Positions and other factors

Positionally, the most identifiable change in King’s game came with a consistency of his role becoming central as his scoring run started. Before Christmas he spent time on the right of Bournemouth’s attack, a couple of games on the left and was a substitute on a handful of occasions, as well as time spent at centre forward and a support striker. This move into a pure central role, be it alongside or behind another forward did have an impact on his shooting volume, raising it from 1.5 per 90 minutes played to 2.5, of which as we’ve discussed, a high prevalence of better quality chances enhanced his expected goal rate (latterly 0.4 per 90).

The same before/after split sees an increase in his volume of key passes, from around 0.7 per 90 up to 1.2 after although this flattens to around one per 90 when he is playing centrally apportioned across the whole season. This is a low total, particularly considering his supporting role, and within Bournemouth’s overall 12 shot per game average. He is quite adept with the ball at his feet, and his 2.5 successful dribbles per 90 is on the high side for a central attacking player.

Difficult comparison

This blend of a not very creative running central player is intriguing and uncommonly recreated in the data. Indeed looking for comparative types throws up a variety of decent quality but mainly wide players in their younger seasons, Jordan and Andre Ayew in France, Riyad Mahrez in the Championship. Loosen off the dribbles category and we find 2015 brand Marouane Fellaini (!?). His pass volume of around 20 per game is on the low side for an attacking midfielder and within normal limits for an out and out striker. Should he remain at Bournemouth, and become paired with the notoriously ball-shy Jermain Defoe (whose active ball involvement is fairly similar to Callum Wilson), their attack will remain focused on a midfield that provides for their finishers.

The chief question remains: does 2017 Joshua King profile as a player that could enhance better teams? Is he worth a £30million fee?

Looking at his statistical profile, the goals total from 2016-17 sticks out like a sore thumb in comparison to other factors. There are slight upticks in other areas (shot creation, shots) during 2017, but they don’t appear to diverge significantly from the outputs generated before becoming a core and central player for Bournemouth. Indeed had he replicated the outputs of his 2015-16 season; six goals, two assists, any discussion about his prevailing quality would be moot. On balance, it’s probably correct to presume that 2017-18 will see King continue to be a solid contributor to Bournemouth but not to hit the goal heights of 2016-17. Should this transpire, the idea of £30m bids will wane, and whoever has then become flavour of the month can undergo the same analysis.

Why?

The purpose of this analysis was to give an indication of how much can be done, from nothing more than by simply delving into data. Without recourse to video or sending scouts out, plenty can be learned about the stylistic qualities and trends in a player’s profile. Alongside those analyses, this kind of dissection can and indeed should be performed way in advance of considering bidding for a player. It makes huge sense for clubs to be employing people to do exactly that with a view to enhancing their knowledge ahead of making purchases. Smart clubs will be going much further than this and building player models that mean data for analysis is on tap, visualising player outputs and matching them against their own club’s needs. Multiple leagues can be covered and good practice refined and improved upon.

King represents a relatively simple case for analysis as his goal total has raised his profile, yet is highly likely to be unsustainable. Does that mean signing him would be a mistake? Not necessarily, but it’s imperative that balancing realistic expectation against a large fee and a team’s needs creates a scenario where a club knows what it is getting for its money as far as can be reasonably deduced. With the transfer market inflating and the scope of common sense being employed proving to be hugely variable, the volume of preparatory work put into a transfer should cover all possible eventualities. Errors will never be eliminated entirely, but minimising them should be a primary target. What was a £10million mistake two or three years ago is now likely to cost multiples of that. Football would be well served in spending comparatively small fractions on smart practices to help them.

_______________________________________

Appendix:

Here are Joshua King’s 2016-17 goals, take a look and see what you think.

https://www.youtube.com/watch?v=Nw2-GqmMI8U&spfreload=10


@jair1970

Quantifying finishing skill

$
0
0

The consensus in the football analytics community appears to be that finishing skill exists, but is only provable given large samples of shots, and hence estimation of this skill for individual players is impossible at worst and problematic at best. The debate took place in 2014: among others, Michael Caley showed that advanced players convert equivalent chances better than the more defensive ones (and later incorporated a player adjustment in an xG model), and Devin Pleuler demonstrated weak year-on-year repeatability of superior shot placement. Mike Goodman neatly summarised the conceptual pitfalls of talking about “finishing skill”; here I use this term in the “outperforming xG” sense. More recently (and most relevantly to the work described below), Sam Gregory showed a basic Bayesian approach to estimating players’ personal conversion rates.

Each of these studies has its merits but, especially looking back from 2017, each is methodologically suboptimal. I say this not to take shots at old work — my own was no better at the time — but to argue for a better, more complete and more powerful approach to the problem. To run through these issues quickly: Michael didn’t analyse individual skill at all but looked at aggregates beyond the player level, meaning that his approach can’t tell you much about one player of interest versus another. Devin’s work was a victim of the contemporary epidemic of repeatability studies, that is using a correlation or lack thereof between season-on-season values of a metric as the indication of whether the metric contains signal. I have argued against this setup in private many times, but it’s time to say publicly that while repeatability as an objective is good, repeatability as a methodology is bad. In a low-sample sport like football, we need to wring every little bit of info from every datapoint, so it is unconscionable to start analysis by halving the sample size. Fortunately, the analytics community appear to have recognized that collectively, and I have not seen many repeatability studies recently. Lastly, Sam’s work is closest in spirit to what follows, but since it was done without accounting for chance quality (ie. xG), we see poacher types topping his list (and Messi; there’s always Messi), in large degree due to their chances being best on average rather than due to individual ability.

My own answer to the finishing skill question is that it not only obviously exists, but it also leaves a measurable trace in small samples of shots. In fact, I was able to show that for many players, including superstars as well as relative unknowns, the probability that they are above-average finishers is very high. Furthermore, even if estimation of the skill of individual players is fraught with uncertainty, quantifying this uncertainty is not only part of our job as analysts, but can itself be an essential contribution, allowing the decision-makers to consume model results in line with their appetite for risk.

METHODOLOGY AND RESULTS

My approach is an xG model where the identity of the player is a factor, and I interpret the player-specific coefficients as a measure of the player’s finishing skill. Of course, if done naively, this would go horribly wrong: the players who have taken very few shots and converted them all by chance would emerge as prime finishers. (There are also computational pitfalls to the naive approach which I won’t go into here.) Hence, it is imperative to not only quantify the uncertainty of the skill estimates, but that the estimates themselves are, loosely speaking, shrunk towards the mean in proportion to how many observations there are for the player. And for that, we need to move beyond fixed-effect regressions. In this article I employ Bayesian inference; for a very gentle and practical introduction to this subject I can recommend the second edition of John Kruschke’s book “Doing Bayesian Data Analysis”.

The complete code for this project is available at https://github.com/huffyhenry/statsbomb-bayesian-shooting/ under the GNU LGPG v3 licence. The dataset that I used consists of 182’288 non-penalty shots from the big 5 European leagues, from 2010/11 onward. These shots were taken by 3906 distinct players, with individual sample size typically less than 100; in fact, only 150 players recorded more than 200 attempts, and only 5 (Cristiano Ronaldo, Messi, Suarez, Lewandowski and Higuain) more than 500. The model itself is a fairly basic logistic regression, taking distance to the center of the goal, visual angle of the goal and several binary features, as well as the player’s identity, as predictors. I specified this model in JAGS, which is a Bayesian inference engine. By performing laborious computations, JAGS is able to distribute the credit for scoring between the player and the circumstances of the shot in the optimal way. Most still goes to the shot’s properties, and in that this model is not that much different from the typical, player-agnostic xG models; in fact, it should recover (approximately) the coefficient values obtained by running a classical, player-agnostic logistic regression on the same data. But some of the credit for scoring (or penalty for missing) accrues to the players, and it is the estimates of these player-specific variables that are the main output of this model.

The graph above shows the best 50 finishers according to the model. The dot marks the estimate of player’s skill; because of the structure of the model, these numbers do not have a direct interpretation in football terms, but higher is better, and 0 means an average finisher. The error bars mark the interval in which the player’s skill lies with 75% probability. Lastly, the probability that a player is an above-average finisher is given in brackets after his name. To run quickly through this list: the top is very satisfying, composed almost entirely of pre-eminent strikers of our age. Long shot merchants are conspicuously well represented too. Shockingly (to me at least) 57 shots were enough for Kylian Mbappe to break into top 30. In a sanity check that all shooting models must pass, Jesus Navas is in the bottom 10. Of notable absentees on the Top 50 list, Pierre-Emerick Aubameyang is around 250th (62% probability of being above-average), Klaas-Jan Huntelaar is ~330th (60%) and Robert Lewandowski ~550th (56%) — all with positive skill estimates, but with CIs comfortably overlapping zero.

And so we arrive at the elephant in the room: out of almost 4000 players, only a handful have skill different from 0 at the 75% confidence level. Does it mean that, as long been suspected, looking for individual finishing skill in the data is a fool’s errand? No. If you are a director of football tasked with signing a good finisher, you should not ignore a model signal at the 75% level (and in fact for many players the confidence in their above-average skill is higher, since the model may be underestimating it). Picking one of the top but available names, like Roma’s and Arsenal’s new buys, would be entirely justified as a calculated gamble, seeing how the probability that they are not above-average finishers is very low. Second, in part to keep this analysis manageable and in part because I had only this data on hand, I limited myself to the Big Five over the last few seasons. Including second division data for these five countries, feeder leagues like the Eredivisie, as well as the Champions and Europa Leagues would significantly boost sample sizes for many players and shrink their CIs.

DISCUSSION

Let’s discuss the shortcomings of this analysis now. Enamoured as I am with explicit modelling of uncertainty and with the ability to treat players very much like first-class citizens of the model, the analysis is problematic for several reasons, to the point that I would not recommend direct application of this implementation in scouting. The main issues in a rough order of importance are as follows:

First and foremost, my model knows nothing about shot placement and force. Arguably, players should receive credit for hammering their shots towards the corners of the goal, even if these shots are saved, and should be penalised for shooting tamely towards the center of the goal — perhaps even if they do score. I would expect placement and force to not only change the results of this analysis in terms of the top 50 list, but also to contain enough information to push the estimates for many players further away from the 0 line, ie. bring about much more confidence into the assessment of individual players. After all, this was the main take-away from Devin’s article. In the same vein, an industrial-grade model should include the goalkeepers as well.

Second, the xG model I used here is relatively basic. If it consistently underestimates the quality of the chances falling to a particular player, then this player is going to incorrectly receive extra credit for converting them (and be unfairly penalised in case of overestimation). This is a milder version of the problem with Sam Gregory’s analysis. On the other hand, certain circumstances that we normally think of as being shot descriptors can also be viewed as part of the player’s finishing, and should not be included in the underlying model; this is why I don’t tell the model whether the shot follows a successful dribble by the player. Lastly, the ~200k sample used to build the model is also not as big as it could be, perhaps leading to incomplete separation of player and shot  circumstance effects for some rarer on-pitch situations.

Third (this is a bit technical), the skill is conceptualised as an additive boost to the linear predictor in a logistic regression. If you recall the shape of the logistic function, it becomes clear that adding a fixed value (ie the skill) to the argument can have a radically different effect on the outcome depending on the argument value. More precisely, adding a fixed quantity to a very low or very high value has a smaller effect than adding to a value near 0, where the function value changes the sharpest. But 0 corresponds to shot xG of 0.5, which is very very high in the wild, so we can ignore the high end. Thus, if players A and B consistently convert at double their xG, but player A’s average xG/shot is higher than player B’s, then the model will estimate A’s finishing skill as lower than B’s. This effect may explain the strong presence of long distance shooters on the top 50 list, and partially also Rodriguez’ high place. Having the skill term enter the predictor in a  different way could alleviate the problem to a degree.

Fourth, the Bayesian prior on shooting skill that I used is arbitrary (0-centered normal with 0.01 variance), and in the small-sample environment that we have here, the selection of priors has considerable impact on the final results. In an earlier version of this analysis, I used a much less committal prior, which resulted in a few odd names creeping up the list purely because they converted a large proportion of their relatively few chances and the model had to price in the possibility that they possess superhuman finishing ability. I believe that the model would benefit significantly from a set of priors that better reflect our beliefs about finishing, but that is difficult because, as discussed above, the skill variable has no direct interpretation.

Fifth, the model assumes single finishing skill for a player, when I can think of at least four distinct skills: stronger foot, weaker foot, head and long range. It would make sense to at least remove the headers from the dataset, even though the eye test and some anecdotal evidence suggests that head and foot finishing skills are correlated. But what the plots above make reasonably clear is that subdividing the shots into even smaller samples is going to make the CIs balloon, unless perhaps in the rarer cases where the player is above-average finisher of one kind and below-average of the other. One thing that could help a little would be to include the information whether the shot was taken with the weaker foot as a single covariate (ie shared by all players), but I don’t have foot preference data.

EPILOGUE

Bayesian models are powerful and intuitive, but they do have practical drawbacks. The leading Bayesian inference engines require specifying the model in their own domain-specific languages inspired by these ideals of elegance and succinctness that are C++ (Stan) and R (JAGS). Fitting these models on datasets of typical size in football analytics, ie. hundreds of thousands of datapoints, takes hours if not days. And assessing convergence of the model requires an uncomfortably deep understanding of MCMC techniques. For these reasons, I have replicated this analysis using Generalized Linear Mixed Model (GLMM) framework from the R package lme4, specifying the usual xG model predictors as fixed effects and players as random effects. The code for this analysis is also included in the repository above. The encouraging news is that the skill estimates between full Bayes and GLMM are very highly correlated. Since both models estimate the same model, the agreement cannot be taken as validation of my analysis; but it does suggest very strongly that GLMMs are a valid, scaleable alternative to full Bayes.


I am indebted to Will Gürpınar-Morgan, Martin Eastwood, Devin Pleuler, Sam Gregory and Ben Torvaney, who read an earlier version of this article and provided feedback which improved it considerably. Łukasz Szczepański taught me how to use GLMMs to study players, and Thom Lawrence inspired me to get serious about Bayesian inference. The data used in the article was collected by Opta.


Scouting Leon Bailey

$
0
0
This article was co-authored by @MoeSquare and @EuanDewar. Chances are you’ve heard someone wax lyrical about Leon Bailey this season. The...
Viewing all 25 articles
Browse latest View live